

说明
侵略性增量成交量剖面(真实Tick聚合)
通过侵略性增量成交量剖面提升您的市场分析,这是一款专为cTrader设计的高级机构级Tick流工具。不同于依赖不精确估算的标准成交量剖面,该工具通过精确映射成交发生的具体位置,实现绝对透明。
标准成交量剖面的问题
市场上大多数成交量剖面采用捷径:他们将一根K线的总成交量人为地分布在最高价和最低价区间内。这种方法产生了猜测和平滑的估计,完全忽略了隐藏的机构区块、被困交易者和实际的高流动性节点。
侵略性增量解决方案:真实Tick聚合
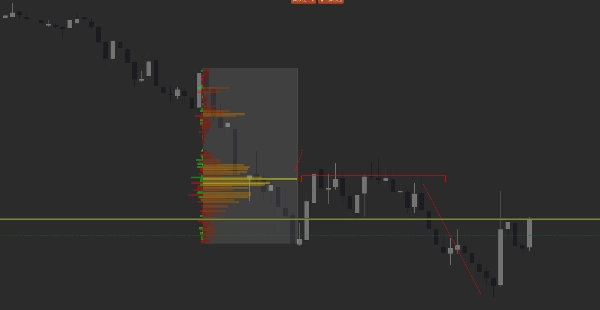
侵略性增量成交量剖面不进行猜测。它利用cTrader的原生历史Tick引擎处理您选定区域内的每一个原始价格更新。它计算每个精确分数价格点的成交量,并将其分为实时买卖增量。您看到的不是近似值——而是市场流动性的真实足迹。
主要特点
-
- 真实历史Tick数据处理: 利用毫秒级精确的Tick历史数据生成无损的实时成交量结构。
- 双引擎锚定模式:
-
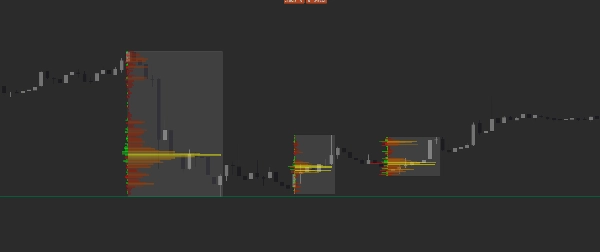
- 趋势线模式: 只需在任意摆动或波段上绘制标准趋势线,即可自动在其起止时间间包裹局部成交量剖面。支持多重并发剖面及左右对齐。
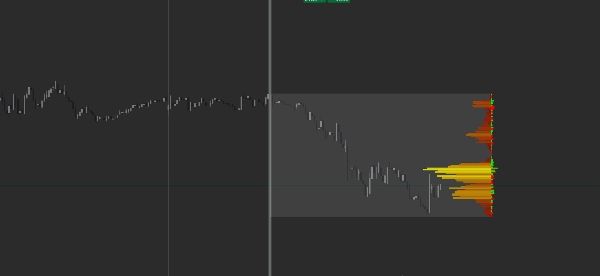
- 垂直线(锚点)模式: 在图表任意位置放置垂直线,锚定一个动态剖面,该剖面从该结构关键点延伸至当前实时市场K线。
- 趋势线模式: 只需在任意摆动或波段上绘制标准趋势线,即可自动在其起止时间间包裹局部成交量剖面。支持多重并发剖面及左右对齐。
- 高级成交量热图与Tick流增量:
-
- 通过平滑色彩渐变可视化高成交量节点(POC区域)与低成交量空白区的集中度。
- 具备叠加的增量剖面(买卖追踪),基于逐Tick的激进市场订单,实时显示谁掌控特定价格水平。
- 通过平滑色彩渐变可视化高成交量节点(POC区域)与低成交量空白区的集中度。
- 无闪烁用户体验优化: 采用异步数据加载状态和智能缓存架构,确保您的图表在剧烈市场波动时依然极其流畅、响应迅速且无界面延迟。
- 真实历史Tick数据处理: 利用毫秒级精确的Tick历史数据生成无损的实时成交量结构。
使用方法
-
- 趋势线剖面: 绘制趋势线以隔离特定交易时段、新闻事件或修正波段。指标会自动隐藏趋势线,并用美观、定制的成交量剖面替代。您可以精确选择转换为成交量剖面的趋势线数量。超出该限制的额外趋势线将自动作为标准图表线使用。
- 垂直锚点剖面: 在主要摆动高点/低点、交易时段开始或宏观经济发布时刻放置垂直线。剖面将随每个新Tick动态更新,整齐投射至图表右侧,并可自定义偏移,避免遮挡价格走势。只有最新的垂直线作为动态剖面锚点,其他垂直线将保持标准未变。
- 趋势线剖面: 绘制趋势线以隔离特定交易时段、新闻事件或修正波段。指标会自动隐藏趋势线,并用美观、定制的成交量剖面替代。您可以精确选择转换为成交量剖面的趋势线数量。超出该限制的额外趋势线将自动作为标准图表线使用。
技术规格与参数
-
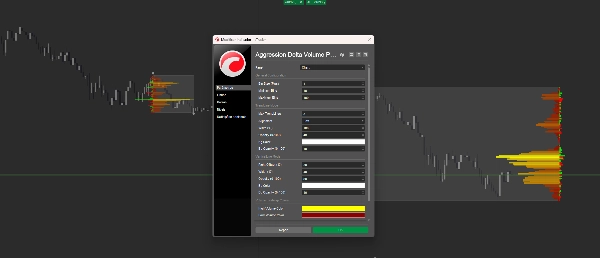
- 箱体大小(点数): 完全可定制的粒度(从微观剥头皮的0.1点到宏观结构)。
- 箱体阈值: 设置最小和最大限制,保持布局整洁,无论市场波动如何。
- 美学控制: 完全控制透明度、背景填充、热图渐变和增量颜色,完美匹配任何深色或浅色图表主题。
- 箱体大小(点数): 完全可定制的粒度(从微观剥头皮的0.1点到宏观结构)。
为何选择此指标?
如果您交易支撑/阻力突破、拍卖市场理论或机构订单区块,猜测成交量分布会让您亏钱。使用此指标,将原始Tick数据转化为可操作的高概率执行区,赋予您决定性的优势。
立即获取侵略性增量成交量剖面,开始洞察真实市场。
摘要
AI summary
The Aggression Delta Volume Profile is an institutional-grade order flow indicator designed for cTrader that provides precise volume mapping using true historical tick data. Unlike standard volume profiles that estimate volume distribution across price ranges, this tool processes every raw tick within a selected area to display exact traded volume at fractional price points. It splits volume into real-time Buy/Sell Delta, revealing the actual market liquidity footprint.
Key features include two anchoring modes: Trendline Mode, which creates localized volume profiles between drawn trendline points, and Vertical Line Mode, which anchors dynamic profiles from a chosen price level to the current market. The indicator visualizes volume concentration with a heatmap highlighting high-volume nodes and overlays a Delta Profile to track aggressive buy versus sell orders. It supports customizable bin sizes and thresholds for granular volume analysis and offers full aesthetic controls for integration with various chart themes.
The indicator is optimized for smooth performance with asynchronous data loading and caching to maintain responsiveness during volatile market conditions. It is suited for traders focusing on support/resistance breakouts, auction market theory, and institutional order blocks by providing actionable insights based on exact tick-level volume data.
Key features include two anchoring modes: Trendline Mode, which creates localized volume profiles between drawn trendline points, and Vertical Line Mode, which anchors dynamic profiles from a chosen price level to the current market. The indicator visualizes volume concentration with a heatmap highlighting high-volume nodes and overlays a Delta Profile to track aggressive buy versus sell orders. It supports customizable bin sizes and thresholds for granular volume analysis and offers full aesthetic controls for integration with various chart themes.
The indicator is optimized for smooth performance with asynchronous data loading and caching to maintain responsiveness during volatile market conditions. It is suited for traders focusing on support/resistance breakouts, auction market theory, and institutional order blocks by providing actionable insights based on exact tick-level volume data.
指标配置
指标分类
交易量
输出类型
可视化
数据要求
交易量
跳动点数据
市场深度
支持的信号
趋势强度
波动性
触及水平位
突破水平位
客户评价
0.0
评价:0
客户评价
该产品尚无评价。已经试过了?抢先告诉其他人!
讨论
常见问答
Order Block
Volume
Market Structure
cTrader Store 提供的所有产品,包括交易机器人、指标和插件,均由第三方开发者提供,仅供信息参考和技术访问之用。cTrader Store 并非经纪商,不提供投资建议、个人推荐或任何未来业绩保证。

























!["[Stellar Strategies] MARSI Signal Plotter" 标识](https://cdn.ctrader.com/image/webp/7b2b8da6-8f8e-4646-8d4a-4710c516c01e_25567)
价格
注册日期 14/02/2025
17
销售