present
가입하고 첫 구매 시 $50 할인을 받으세요
Trading product for Fixed Range Volume Profile Pro 지표 Key Levels Volume, image 1
Fixed Range Volume Profile Pro
지표
버전 1.0, Oct 2026
Windows, Mac
Trading product for Fixed Range Volume Profile Pro 지표 Key Levels Volume, image 2
Trading product for Fixed Range Volume Profile Pro 지표 Key Levels Volume, image 3
Trading product for Fixed Range Volume Profile Pro 지표 Key Levels Volume, image 4
Trading product for Fixed Range Volume Profile Pro 지표 Key Levels Volume, image 5
Trading product for Fixed Range Volume Profile Pro 지표 Key Levels Volume, image 6
Trading product for Fixed Range Volume Profile Pro 지표 Key Levels Volume, image 7
가입일 14/05/2026
161.59K
거래량
142.43K
핍 수익
1.04K
무료 설치

설명

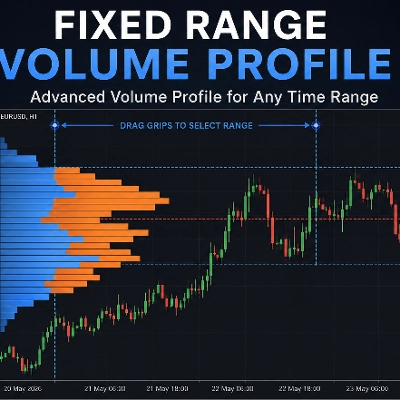
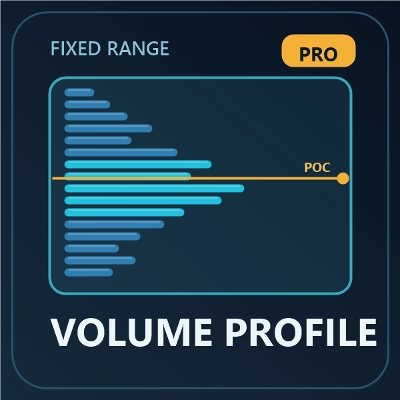
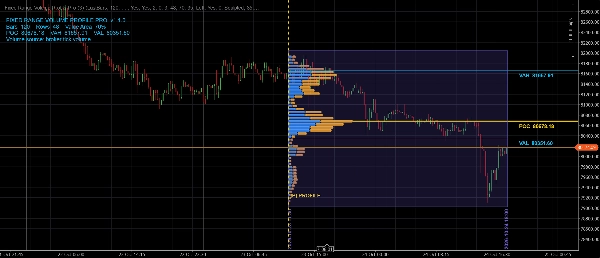
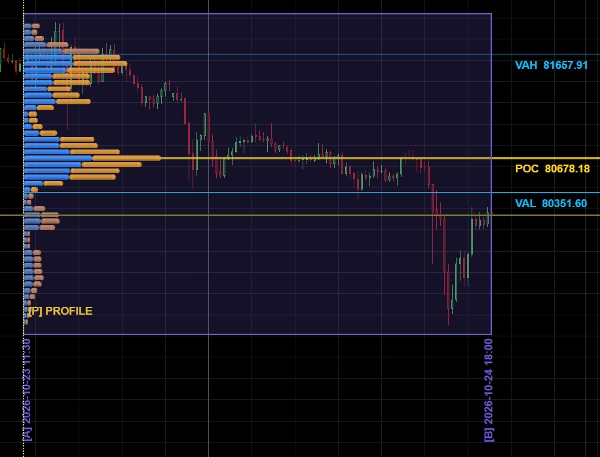
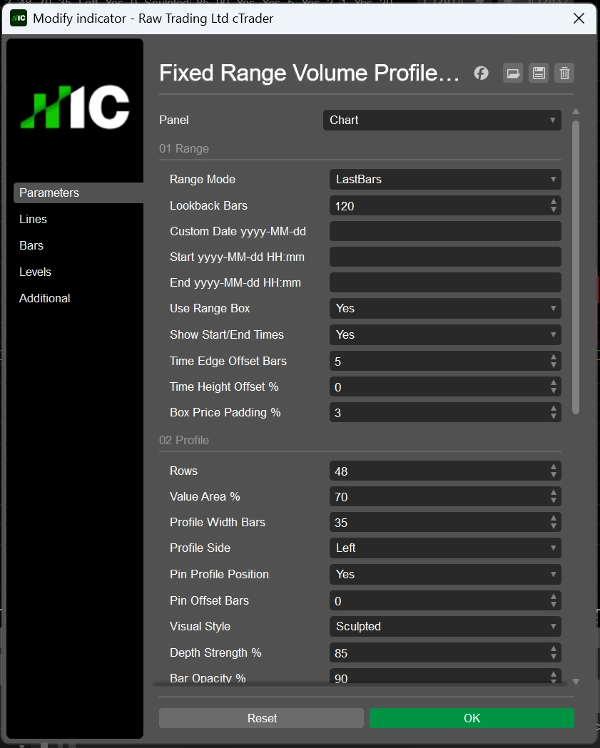
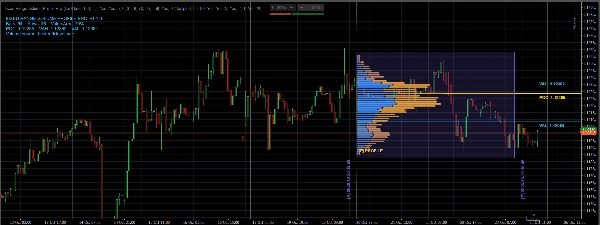
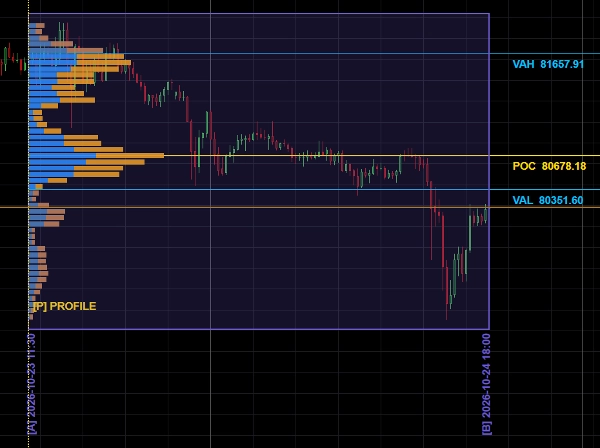
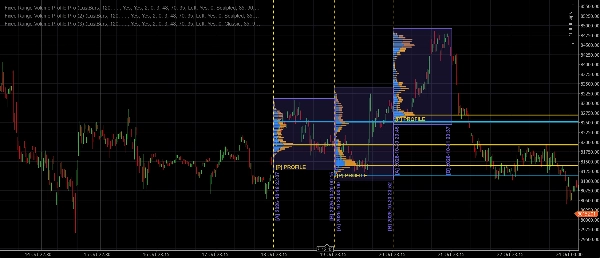
Fixed Range Volume Profile Pro maps broker tick volume across price levels within a selected time range. Move or resize the translucent range box directly on the chart. The sculpted, cylindrical-style histogram follows the box while retaining its relative position, and a separate pin lets you place the profile where it is easiest to read.


Key features

• Interactive range box with automatic price height and adjustable width

• Configurable number of price rows, profile width, colors, opacity and value-area percentage

• POC, Value Area High (VAH) and Value Area Low (VAL), with optional price labels and rightward extensions

• Estimated upward and downward volume coloring, with separate colors inside and outside the value area

• Last-bars, previous-day, custom-date and custom-date-time range modes

• Optional vertical start/end time labels with edge and height offsets

• Steady chart updates that reuse existing drawing objects


Designed for discretionary volume-profile and price-level analysis. It can be used on FX pairs, metals, indices, crypto and other symbols that provide tick-volume data in cTrader. For intraday analysis, start with liquid markets on M5–H1 charts; increase the lookback and adjust the rows for longer periods. The indicator does not place orders or generate guaranteed trade signals.


Data transparency: this is broker tick volume, not exchange-traded volume. Volume by price is estimated from each candle's body and wicks. Up/down coloring is an OHLC-based estimate, not true bid/ask delta or order flow. Values can differ between brokers and chart histories.


Compatibility: cTrader Desktop (Windows or Mac) 5.10 or later. Custom indicators are not available on cTrader Web or Mobile.


Trading involves risk. Past performance does not guarantee future results.


요약

AI 요약
Fixed Range Volume Profile Pro is an interactive volume profile indicator designed for use on the cTrader Desktop platform (Windows or Mac, version 5.10 or later). It maps broker tick volume across price levels within a user-selected time range using a draggable, translucent range box on the chart. The indicator features a sculpted, cylindrical-style histogram that maintains relative positioning to the range box, with a separate pin to place the profile for optimal readability.

Key functionalities include adjustable range box dimensions, configurable price rows, profile width, colors, opacity, and value-area percentage. It displays Point of Control (POC), Value Area High (VAH), and Value Area Low (VAL) levels, with optional price labels and extensions. Volume bars are color-coded to estimate upward and downward volume inside and outside the value area. The indicator supports multiple range modes such as last-bars, previous-day, custom-date, and custom-date-time, with optional vertical time labels.

Designed for discretionary volume-profile and price-level analysis, it is suitable for FX pairs, metals, indices, cryptocurrencies, and other symbols providing tick-volume data. Volume estimates are based on broker tick data and candle OHLC values, not exchange-traded volume or true order flow. The indicator updates steadily by reusing existing drawing objects and does not generate trade signals or place orders.
지표 프로필
지표 카테고리
거래량
출력 유형
시각화
데이터 요구 사항
틱 데이터
거래량

상담

고객 리뷰

0.0
리뷰: 0
고객 리뷰
이 상품에 대한 리뷰가 아직 없습니다. 이미 사용해 보셨나요? 다른 사람들에게 가장 먼저 소개해 주세요!

자주 묻는 질문(FAQ)

Key Levels
Volume
트레이딩 봇, 지표, 플러그인 등 cTrader Store에서 제공되는 상품은 제3자 개발자에 의해 제공되며, 이는 단순히 정보 및 기술적 접근을 목적으로 제공된 것입니다. cTrader Store는 중개인이 아니며, 투자 조언, 개인별 추천 또는 향후 성과에 대한 어떠한 보장도 제공하지 않습니다.

이 작성자의 상품 더 보기

지표
Volume
Fixed Range Volume Profile
지표
Key Levels
Liquidity Grab
+1
Visualize Asia, London and New York sessions with range boxes, opening levels, prior-day highs/lows and sweep markers.
데스크톱 플러그인
Trade Journal
Session Filter
+1
Read-only cTrader journal with a P/L calendar, monthly performance review, session breakdown and daily bar chart.

좋아하실 만한 다른 항목

지표
SMC
Prop
+16
📊 VWAP with MTF & Dynamic Deviation Bands
"FBX VWAP" 로고
최고 평점
4.5
(4)
$19
지표
Prop
VWAP
+12
FBX VWAP Anchored — Professional VWAP
지표
AI
ATR
+27
Trade the Trend Flip. Control the Risk. 🎯📈”
지표
The Break of Structure (BoSCHoCh) Indicator is a smart market structure tool designed to help traders easily spot trend.
지표
Auto-detect supply & demand zones, remove broken levels, and trade smarter with real-time alerts. Precision made simple.
지표
Advanced price action tool that combines multiple technical analysis concepts
지표
Prop
Forex
+9
Trend Sniper — session-based tool highlighting live session ranges and adaptive Custom line.
지표
ADX
ATR
+5
Configure, simulate, and analyze trading strategies with custom filters, multi-target exits, and detailed performance me
지표
ATR
EMA
+5
Candle timer with live profit tracking on chart – displays pips, currency value, and percentage in real time.
지표
Forex
Crypto
+5
Automatically plots Fibonacci retracement levels using the highest and lowest points of a customizable time range
지표
Prop
Forex
+4
HMA MTF 2.0 (Multi-Timeframe )
지표
Three ZigZag lines
지표
Parabolic SAR Alert - Trend reversal alerts with smart signals & custom alerts.
지표
RSI
MACD
+7
The ZigZag indicator is a technical analysis tool primarily used to identify key price reversal points.
지표
VWAP
Support & Resistance
Trading.FC$_vwap Algo shows VWAP trends, dynamic support/resistance and deviation bands to spot potential trade entries.
지표
Key Levels
Market Structure
+1
See the day's percentage targets from the open, so you know where the session stands at a glance.
지표
MACD
Forex
+1
😎Read the description before purchasing💩
지표
AI
Prop
+9
A cutting‑edge trading indicator that fuses AI and mathematics with adaptive logic to classify market regimes.

가격

가입일 14/05/2026
161.59K
거래량
142.43K
핍 수익
1.04K
무료 설치