
Descrizione
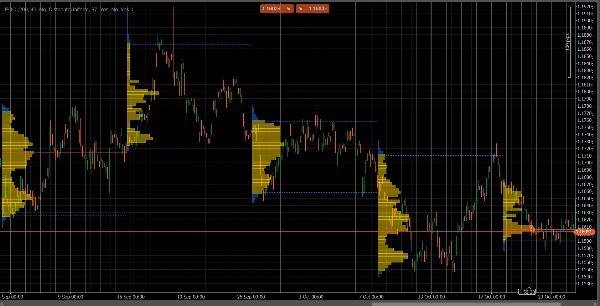
VolumeProfileSuite è un indicatore avanzato e flessibile di Volume Profile per cTrader.
Il suo scopo principale è analizzare la distribuzione del volume (cioè, dove si è verificata l'attività di trading) a diversi livelli di prezzo per identificare aree di "valore" (alto volume) e "rifiuto" (basso volume). Questo ti aiuta a trovare i livelli di supporto e resistenza più significativi basati sull'attività reale del mercato.
La sua caratteristica unica è che combina due potenti modalità di analisi in un unico strumento, selezionabile tramite il parametro Profile Mode:
FixedRangeMode: Perfetto per l'analisi macro. Permette di analizzare un singolo, grande blocco a tua scelta (come le ultime 1000 barre o un intervallo di date specifico, ad esempio "tutta la scorsa settimana"). È ideale per trovare livelli di supporto/resistenza maggiori e a lungo termine.PeriodicMode: Perfetto per l'analisi micro e comportamentale. Disegna automaticamente un nuovo profilo ogni "N" barre (ad esempio, ogni 100 barre). Questo ti permette di vedere come il POC e l'Area di Valore evolvono nel tempo e di studiare i modelli ripetitivi del mercato.- Guida ai Parametri (Inglese)
Ecco la guida aggiornata per il tuo nuovo indicatore unificato VolumeProfileSuite. Questa guida è fondamentale poiché spiega quali parametri utilizzare (e quali ignorare) in base alla modalità selezionata.
Gruppo 1: Modalità Principale
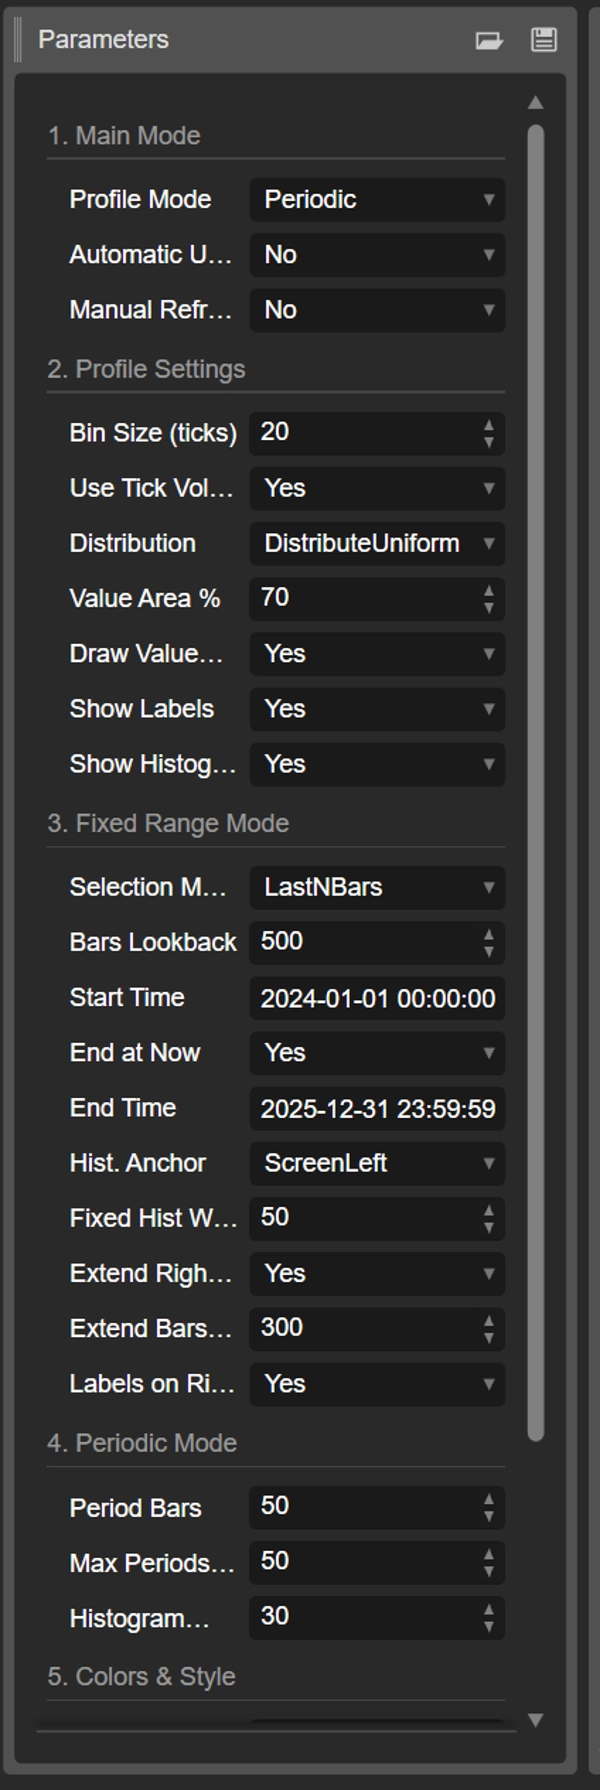
- Profile Mode: Questo è il parametro più importante e funge da interruttore principale.
-
FixedRange: Attiva la modalità "blocco singolo". L'indicatore analizzerà solo un intervallo specificato da te (usando le impostazioni nel Gruppo 3).Periodic: Attiva la modalità "ciclica". L'indicatore analizzerà automaticamente l'intero grafico a blocchi (basato sulle impostazioni nel Gruppo 4).
IMPORTANTE: Quando sei in modalità
FixedRange, devi ignorare tutti i parametri del "Gruppo 4: Modalità Periodica". Quando sei in modalitàPeriodic, devi ignorare tutti i parametri del "Gruppo 3: Modalità Fixed Range".
Gruppo 2: Impostazioni del Profilo
Questi parametri sono comuni e si applicano a entrambe le modalità (FixedRange e Periodic).
- Dimensione Bin (ticks): Controlla la "risoluzione" verticale del profilo. Un valore basso (ad esempio
1) crea molte righe di prezzo sottili (molto dettagliato). Un valore alto (ad esempio10) raggruppa i prezzi in righe più spesse (meno dettagliato, "più liscio"). - Usa Tick Volume: Se
true(consigliato), il profilo usa il volume reale dei tick, che è molto preciso. Sefalse, conta semplicemente "1" per ogni barra. - Distribuzione: Definisce come viene distribuito il volume di una barra.
-
DistributeUniform(predefinito): "Distribuisce" il volume della barra su tutti i livelli di prezzo toccati, dal minimo al massimo.CloseOnly: Assegna tutto il volume della barra solo al prezzo di chiusura.
- Percentuale Area di Valore: Imposta la percentuale di volume che costituisce l'"Area di Valore" (l'area di maggiore attività di scambio). Un valore di
70(70%) è lo standard di mercato. - Disegna Area di Valore (VAH/VAL): Se
true, disegna le linee orizzontali per il Value Area High (VAH) e il Value Area Low (VAL). - Mostra Etichette: Se
true, mostra etichette di testo ("POC", "VAH", "VAL"). (Attenzione: in modalitàPeriodic, questo può sovraccaricare il grafico). - Mostra Istogramma: Se
true, disegna l'istogramma del volume (le barre orizzontali).
Gruppo 3: Modalità Fixed Range
⚠️ Usa questi parametri SOLO se "Profile Mode" è impostato su FixedRange.
- Modalità di Selezione: Sceglie come definire il tuo singolo blocco.
-
DateRange: Usa una data/ora di inizio e fine specifica.LastNBars: Usa le ultime N barre.
- Bars Lookback: (Solo per
LastNBars) Quante barre indietro analizzare (ad esempio,500). - Ora Inizio / Fine a Ora Attuale / Ora Fine: (Solo per
DateRange) Definisce l'inizio e la fine del tuo intervallo. - Ancora Istogramma: (Solo per
FixedRange) Definisce dove ancorare l'istogramma. -
DateRangeStart: All'inizio del tuo intervallo (può essere fuori schermo).ScreenLeft: Al bordo sinistro della finestra visibile.ScreenRight: Al bordo destro della finestra visibile (nello spazio vuoto).
- Larghezza Istogramma Fissa (barre): La larghezza dell'istogramma (in barre) per la modalità
FixedRange. - Estendi Solo a Destra: Se
true, le linee POC/VAH/VAL sono estese nel futuro. - Estendi Barre: (Solo se
Extend Right Onlyètrue) Di quante barre estendere le linee. - Etichette a Destra: Se
true, posiziona le etichette di prezzo all'estremità destra delle linee estese.
Gruppo 4: Modalità Periodica
⚠️ Usa questi parametri SOLO se "Profile Mode" è impostato su Periodic.
- Barre per Periodo: Questo è il parametro chiave per questa modalità. Definisce quante barre includere in ogni blocco ciclico (ad esempio,
100). - Numero Massimo di Periodi da Disegnare: 🌟 PARAMETRO DI SICUREZZA! Limita il numero di profili ciclici disegnati per evitare che cTrader si blocchi.
50significa che disegnerà solo gli ultimi 50 profili, anche se la cronologia ne contiene di più. Non impostare questo valore troppo alto (ad esempio, > 200) o cTrader potrebbe bloccarsi! - Larghezza Istogramma (barre): La larghezza dell'istogramma (in barre) per ogni blocco ciclico.
Gruppo 5: Colori e Stile
Questi parametri sono comuni e si applicano a entrambe le modalità.
- Colore POC: Il colore della linea del Point of Control.
- Colore VA: Il colore delle linee VAH e VAL.
- Spessore Linea: Lo spessore delle linee POC, VAH e VAL.
- Colore Istogramma VA: Il colore delle barre dell'istogramma all'interno dell'Area di Valore (predefinito: Giallo).
- Colore Istogramma Esterno: Il colore delle barre dell'istogramma all'esterno dell'Area di Valore (predefinito: Blu).
- Opacità Istogramma %: La trasparenza (opacità) dell'intero istogramma.
Riepilogo
The indicator offers two main analysis modes selectable via the Profile Mode parameter:
1. FixedRange Mode: Analyzes a single user-defined interval, such as a specific date range or the last N bars, suitable for macro-level, long-term support and resistance identification.
2. Periodic Mode: Automatically segments the chart into consecutive blocks of N bars, drawing a new profile for each. This mode supports micro-level and behavioral analysis by tracking how the Point of Control (POC) and Value Area evolve over time.
Common configurable settings include bin size (price resolution), volume type (tick volume or bar count), volume distribution method, value area percentage, and visual options such as histogram display and labeling. FixedRange and Periodic modes have distinct parameter groups to tailor their respective analyses.
Color and style options allow customization of POC, Value Area lines, and histogram appearance. The tool supports various markets including Forex, indices, commodities, stocks, and cryptocurrencies, as indicated by its relevant tags.
Recensioni dei clienti
5 | 50 % | |
4 | 50 % | |
3 | 0 % | |
2 | 0 % | |
1 | 0 % |


