
Opis
Jeśli szukasz dynamicznego wskaźnika kanału Fibonacciego dla cTrader, nie szukaj dalej. Ten wskaźnik automatycznie rysuje pasma Fibonacciego równolegle do wybranej przez Ciebie średniej kroczącej. Jest przyjazny dla użytkownika i, podobnie jak moje inne wskaźniki, zapewnia alerty poprzez wyskakujące okienka, dźwięk, e-mail oraz wiadomości na Telegramie. Dodatkowo masz możliwość dostosowania pasm, poziomów Fibonacciego oraz alertów.
Oto lista jego funkcji:
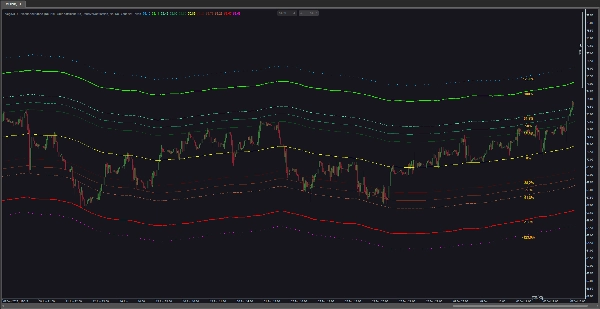
- Obliczanie pasm Fibonacciego: Wskaźnik oblicza i rysuje pasma Fibonacciego na podstawie wybranej średniej kroczącej. Pasma te pochodzą z poziomów Fibonacciego (np. 0,0%, 38,2%, 61,8% lub innych) i rozciągają się powyżej i poniżej średniej kroczącej o określony współczynnik.
- Konfiguracja średniej kroczącej: Dostosuj typ średniej kroczącej (np. prosta, wykładnicza itp.) oraz liczbę okresów używanych w obliczeniach. Średnia krocząca stanowi podstawę dla pasm Fibonacciego.
- Funkcjonalność alertów: Wskaźnik oferuje różne opcje alertów, które powiadamiają traderów o określonych zdarzeniach. Obejmuje to alerty dotknięcia poziomu cenowego oraz alerty bliskości.
- Alerty dotknięcia poziomu cenowego: Skonfiguruj wskaźnik tak, aby wywoływał alerty, gdy cena dotknie określonych poziomów Fibonacciego. Alerty mogą być oparte na cenie zamknięcia lub natychmiast po dotknięciu poziomu przez cenę.
- Alerty bliskości: Ustaw alerty bliskości, aby otrzymywać powiadomienia, gdy cena zbliża się do lub oddala od określonego poziomu Fibonacciego w określonej odległości. Alerty mogą być wywoływane, gdy cena się zbliża lub oddala od poziomu.
- Opcje wyjścia alertów: Wybierz spośród alertów dźwiękowych, wyskakujących okienek, wiadomości na Telegramie oraz powiadomień e-mail. Alerty dźwiękowe można dostosować, wybierając różne pliki dźwiękowe.
- Opcje wizualizacji: Dostosuj wizualizację poziomów Fibonacciego za pomocą opcji takich jak wyświetlanie wartości procentowych, ustawianie koloru etykiet procentowych, kontrola położenia etykiet na wykresie, włączanie/wyłączanie poszczególnych pasm oraz wybór koloru, grubości i wyglądu pasm.
- Konfigurowalne poziomy Fibonacciego: Dostosuj wskaźnik do swojej strategii handlowej, zmieniając konkretne poziomy Fibonacciego używane w obliczeniach. Poziomy Fibonacciego dodatnie i ujemne można dostosować indywidualnie.
- Wbudowany przewodnik użytkownika: Możesz uzyskać dostęp do przewodnika użytkownika tego wskaźnika bezpośrednio z wykresu.
Podsumowując, wskaźnik VegaXLR - Fibonacci Bands łączy analizę Fibonacciego i średnie kroczące, aby pomóc zidentyfikować potencjalne poziomy wsparcia i oporu. Dzięki konfigurowalnej funkcjonalności alertów i opcjom wizualizacji jest to nieocenione narzędzie dla traderów, którzy polegają na zniesieniach lub rozszerzeniach Fibonacciego.
Podsumowanie
It features multiple alert options including price level touch alerts—triggered on price contact or close at specified Fibonacci levels—and proximity alerts that notify when price approaches or moves away from these levels within a defined range. Alerts can be delivered via pop-up, sound (with customizable sounds), email, and Telegram messages.
Visualization settings enable customization of band colors, thickness, label display and position, and selective enabling or disabling of bands. A built-in user guide is accessible directly from the chart for ease of use.
Overall, VegaXLR - Fibonacci Bands combines Fibonacci retracement and expansion analysis with moving averages to assist traders in identifying potential support and resistance zones, enhanced by configurable alerts and visualization options.
Opinie klientów
5 | 100 % | |
4 | 0 % | |
3 | 0 % | |
2 | 0 % | |
1 | 0 % |


