
Opis
🧭 Anchored VWAP+ | Edycja Volatility Envelope
Anchored VWAP+ to precyzyjne narzędzie nakładkowe łączące logikę VWAP uwzględniającą sesje z dynamicznymi pasmami odchylenia standardowego ±1σ i ±2σ. Zaprojektowane dla traderów polegających na wolumenowo ważonym biasie i strefach zmienności, ten wskaźnik oferuje pełną kontrolę nad kotwiczeniem i szerokością obwiedni.
🔹 Kluczowe funkcje
- Niestandardowa logika kotwiczenia
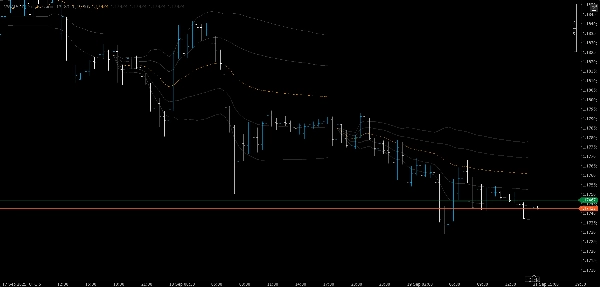
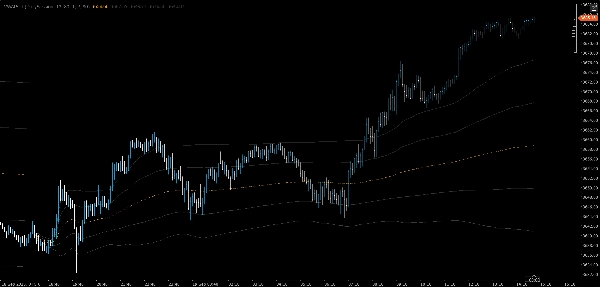
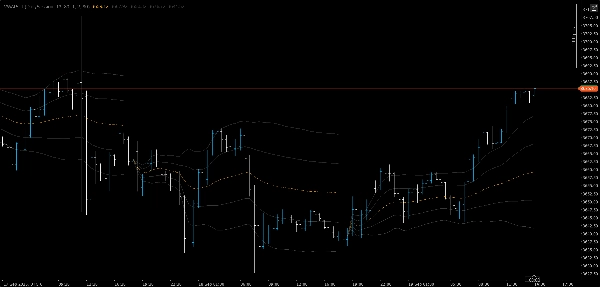
Resetowanie VWAP na początku każdej sesji, otwarciu Nowego Jorku lub dowolnej zdefiniowanej przez użytkownika godzinie UTC. Kotwiczenie jest czyste i nieciągłe, zapewniając jasność reżimu. - Obwiednia zmienności z podwójnymi parametrami k
Rysuj cztery adaptacyjne pasma: ±1σ i ±2σ, z których każde kontrolowane jest przez własnykmnożnik. Dostosuj szerokość obwiedni do czułości swojej strategii. - Nieciągła linia VWAP
VWAP wizualnie resetuje się w każdym punkcie kotwiczenia, unikając mylącej ciągłości między sesjami.
⚙️ Parametry
Typ kotwicy
Własna godzina/minuta
k1
k2
Przezroczystość linii
Niezależnie od tego, czy handlujesz wybiciami, powrotami czy kompresją zmienności, Anchored VWAP+ daje Ci jasność, kontrolę i wizualną precyzję, aby działać z pewnością siebie.
Daj znać, jeśli chciałbyś dopasowane hasło, zestaw ikon lub odznakę do kompletu. Możemy nadać temu branding flagowy.
Podsumowanie
The indicator plots four adaptive bands representing ±1 and ±2 standard deviations, each adjustable via independent multiplier parameters (k1 and k2). This allows traders to fine-tune the volatility envelope width to align with their specific trading strategies. Key parameters include anchor type, custom hour and minute settings, and line opacity control.
Designed for markets including Forex (e.g., EURUSD), indices, and commodities like gold (XAUUSD), Anchored VWAP+ supports trading styles such as breakout and scalping. It provides visual clarity and control over volume-weighted bias and volatility zones, aiding decision-making in breakout, reversion, or volatility compression scenarios.
Opinie klientów
5 | 100 % | |
4 | 0 % | |
3 | 0 % | |
2 | 0 % | |
1 | 0 % |


