
KaufmanEfficiencyRatio
Wskaźnik
78 pobrania
Wersja 1.0, Sep 2025
Windows, Mac
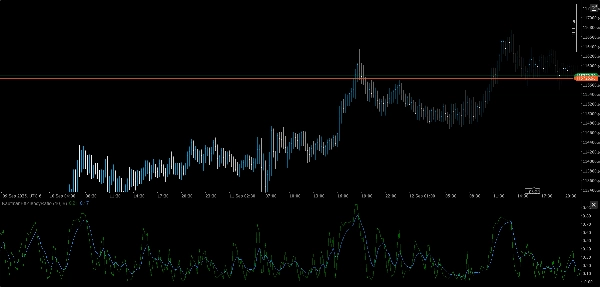
⚡ Wskaźnik Efektywności Kaufmana (KER)
Jasność trendu, wyrażona liczbowo.
Wskaźnik Efektywności Kaufmana (KER) to precyzyjne narzędzie do mierzenia, jak efektywnie cena porusza się z punktu A do B — bez zagubienia się w szumie. Niezależnie od tego, czy potwierdzasz warunki wybicia, czy filtrujesz boczne wahania, KER daje czysty wynik od 0 do 1, który odzwierciedla kierunkową intencję w stosunku do zmienności.
🔍 Co robi
- Oblicza wskaźnik efektywności Kaufmana:
- Zwraca wartość znormalizowaną od 0 (czysty szum) do 1 (idealny trend)
- Wyraźnie wyróżnia fazy trendu od braku trendu bez żadnej niejednoznaczności
- Idealny do adaptacyjnych nakładek, filtrów faz i bramek sygnałowych
🛠️ Kluczowe cechy
- Modułowy menedżer wejść dla źródeł wielookresowych
- Kompatybilny z różnymi aktywami: FX, kryptowaluty, indeksy, akcje
- Lekka, działająca w czasie rzeczywistym logika bez opóźnień wygładzania
- Plug-and-play z istniejącą architekturą zestawu narzędzi
🎯 Przypadki użycia
- Potwierdzenie trendu: Potwierdź kierunkowe nastawienie przed wykonaniem sygnału
- Filtrowanie szumu: Tłumienie wejść podczas nieefektywnego ruchu cen
- Wykrywanie faz: Połącz z nakładkami uwzględniającymi zmienność dla inteligentniejszych przejść
- Budowanie strategii: Używaj jako kluczowej metryki w logice wybicia, momentum lub nastawienia
💡 Bonus
KER jest darmowy, szybki i bezwzględnie efektywny — tak jak Twój kod. Bez zbędnych dodatków, bez filtrów. Tylko surowa intencja rynku, destylowana.
Profil wskaźnika
0.0
Opinie: 0
Opinie klientów
Ten produkt nie ma jeszcze opinii. Wypróbowałeś(-aś) go już? Bądź pierwszy(-a) i powiedz o tym innym!
Breakout
Scalping
AI
Produkty dostępne za pośrednictwem cTrader Store, w tym boty handlowe, wskaźniki i wtyczki, dostarczane są przez deweloperów zewnętrznych i udostępniane wyłącznie w celach informacyjnych oraz w celu zapewnienia dostępu technicznego. cTrader Store nie jest brokerem i nie zapewnia doradztwa inwestycyjnego, nie udziela spersonalizowanych rekomendacji ani nie gwarantuje przyszłych wyników.


25
Sprzedaż
2.1K
Bezpłatne instalacje