
Fractals
Indicador
2 compras
Versão 1.0, Aug 2025
Windows, Mac
4.0
Avaliações: 2
Descrição
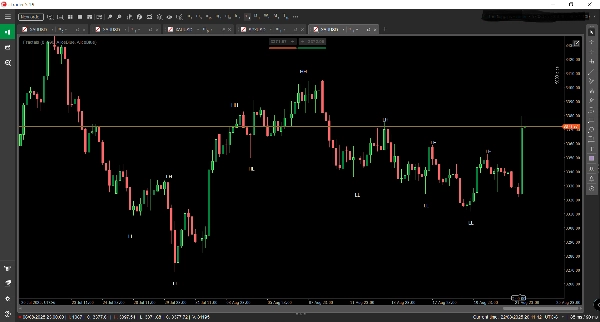
🧠 Fractais – Estrutura de Mercado Visualizada
Fractais é um indicador de negociação de precisão projetado para cTrader que revela a arquitetura oculta da ação do preço. Ao detectar e rotular automaticamente Higher Highs (HH), Higher Lows (HL), Lower Highs (LH), and Lower Lows (LL) diretamente no gráfico, Fractais transforma dados brutos de preço em um mapa claro e acionável da estrutura do mercado.
🔍 Principais Recursos:
- Mapeamento de Estrutura em Tempo Real: Identifica instantaneamente pontos de oscilação e os rotula para expor a direção da tendência e zonas de reversão.
- Consciência Multi-Temporal: Projetado para destacar a estrutura macro em prazos maiores, dando aos traders uma vantagem estratégica ao alinhar entradas com tendências dominantes.
- Otimização para Seguidores de Tendência: Ideal para traders que usam estratégias de momentum, rompimento ou pullback, ajudando a confirmar o viés e evitar armadilhas contra a tendência.
- Sobreposição Visual Limpa: Anotações elegantes no gráfico que se integram perfeitamente a qualquer configuração de negociação, aumentando a clareza sem desordem.
🧭 Casos de Uso:
- Identificar tendências emergentes e mudanças estruturais antes que sejam óbvias.
- Validar configurações de negociação com confirmação estrutural.
- Combinar com médias móveis, volume ou indicadores personalizados para confluência em camadas.
- Perfeito para backtesting manual e avaliações de prop firms onde a lógica baseada em estrutura é fundamental.
Resumo
Resumo de IA
Fractals is a trading indicator designed for the cTrader platform that visualizes market structure by automatically detecting and labeling key price action points: Higher Highs (HH), Higher Lows (HL), Lower Highs (LH), and Lower Lows (LL). It provides real-time mapping of swing points to reveal trend direction and potential reversal zones. The indicator supports multi-timeframe analysis, emphasizing macro structure on higher timeframes to help align trades with dominant market trends. Fractals is optimized for momentum, breakout, and pullback strategies, assisting traders in confirming bias and avoiding counter-trend trades. Its clean visual overlay integrates smoothly with existing chart setups, enhancing clarity without clutter. Use cases include spotting emerging trends and structural shifts early, validating trade setups with structural confirmation, combining with other indicators like moving averages or volume for layered analysis, and supporting manual backtesting and prop firm evaluations where market structure is critical. The indicator applies across various markets including Forex, indices, commodities, cryptocurrencies, and stocks.
Perfil do indicador
Avaliações de clientes
4.0
Avaliações: 2
5 | 0 % | |
4 | 100 % | |
3 | 0 % | |
2 | 0 % | |
1 | 0 % |
Avaliações de clientes
August 31, 2025
it gives the trade idea another check, but the result needs a journal.
August 27, 2025
Conversa
Perguntas frequentes
Prop
Forex
Indices
Commodities
Crypto
Stocks
Os produtos disponíveis através da cTrader Store, incluindo bots de negociação, indicadores e plugins, são fornecidos por programadores terceiros e são disponibilizados apenas para fins informativos e de acesso técnico. A cTrader Store não é um corretor e não fornece aconselhamento em matéria de investimento, recomendações pessoais ou qualquer garantia de desempenho no futuro.


Preço
26
Vendas
2.16K
Instalações gratuitas