
Descrição
📈 pATR – Percentil Média do True Range
Volatilidade de Precisão. Risco Mais Inteligente. Vantagem Institucional.
O pATR redefine o ATR tradicional aplicando um filtro baseado em percentis aos valores recentes do true range, oferecendo aos traders uma visão estatisticamente fundamentada da volatilidade. Em vez de depender de médias simples, o pATR calcula o n-ésimo percentil da intensidade recente do movimento de preços — ajudando você a identificar zonas de rompimento, configurações de retração e limites de risco com precisão cirúrgica.
Quer você esteja enfrentando desafios em firmas proprietárias ou refinando sua estratégia de scalping, o pATR oferece um parâmetro dinâmico de volatilidade que se adapta às condições do mercado e mantém seu risco calibrado.
🔍 Principais Características
• ATR Baseado em Percentil: Filtra ruídos e eventos extremos para sinais de volatilidade mais limpos
• Lógica de Buffer Circular: Otimizado para velocidade e eficiência de memória — sem atrasos, sem confusão
• Pronto para Modo Desafio: Ideal para traders de firmas proprietárias que gerenciam drawdown e limites de trades
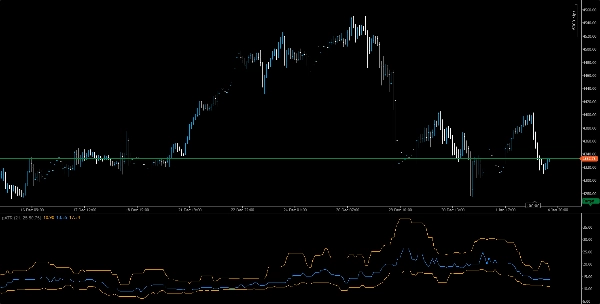
• Visuais Limpos: Linha de volatilidade laranja com opções intuitivas de escala e sobreposição
• Compatível com Múltiplos Timeframes: Use de M1 a H1 para configurações de rompimento, retração ou tendência
🧠 Casos de Uso
• Confirmação de Rompimento: Use picos do pATR para validar entradas de momentum
• Calibração de Risco: Alinhe stop-loss e dimensionamento de posição com a volatilidade percentil
• Backtesting de Estratégia: Valide configurações com limites consistentes de volatilidade
🎯 Para Quem É
• Traders de firmas proprietárias buscando controle de risco baseado em regras
• Scalpers e estrategistas intradiários que precisam de filtros de volatilidade adaptativos
• Traders quantitativos integrando lógica percentil em sistemas personalizados
• Educadores e mentores ensinando execução consciente da volatilidade
Resumo
Key features include an orange volatility line with intuitive scaling and overlay options, compatibility across multiple timeframes from 1-minute to 1-hour charts, and suitability for prop firm traders managing drawdowns and trade limits. pATR helps traders identify breakout zones, fade setups, and risk thresholds with precision.
Use cases cover breakout confirmation through volatility spikes, risk calibration by aligning stop-loss and position sizing with percentile volatility, and strategy backtesting using consistent volatility benchmarks. The indicator is designed for prop firm traders, scalpers, intraday strategists, quantitative traders integrating percentile logic, and educators focusing on volatility-aware execution.
Supported markets include Forex, stocks, indices, commodities, and cryptocurrencies, making pATR a versatile tool for various trading environments.


