
HTFBB
Indicador
1 compras
Versão 1.0, Jul 2025
Windows, Mac
5.0
Avaliações: 1
Descrição
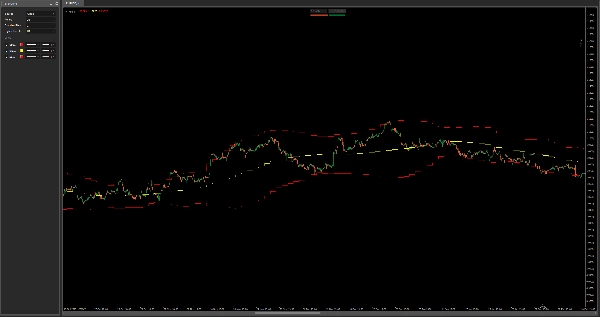
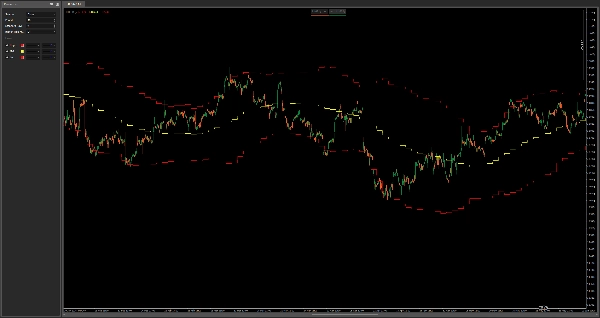
HTF Bollinger Bands – Mapa de Volatilidade Multi-Temporal
Este indicador plota Bandas de Bollinger de um timeframe superior no seu gráfico atual, fornecendo um contexto poderoso para volatilidade, reversão à média e suporte/resistência dinâmicos—tudo isso sem mudar de timeframe.
Recursos:
- Exibe as Bandas de Bollinger superior, média e inferior de qualquer timeframe superior selecionável
- Ótimo para identificar zonas de consolidação HTF, pressão de rompimento, e pullbacks de tendência
- Ideal para scalping e entradas intradiárias com consciência de timeframe superior
- Funciona em todos os ativos e timeframes
Combine com sua estratégia atual para evitar operar em armadilhas de volatilidade e manter-se alinhado com a estrutura macro de preços.
Resumo
Perfil do indicador
Avaliações de clientes
5.0
Avaliações: 1
5 | 100 % | |
4 | 0 % | |
3 | 0 % | |
2 | 0 % | |
1 | 0 % |
Avaliações de clientes
July 29, 2025
confusing signals get easier to ignore, but a clean signal can still fail.
Conversa
Perguntas frequentes
Os produtos disponíveis através da cTrader Store, incluindo bots de negociação, indicadores e plugins, são fornecidos por programadores terceiros e são disponibilizados apenas para fins informativos e de acesso técnico. A cTrader Store não é um corretor e não fornece aconselhamento em matéria de investimento, recomendações pessoais ou qualquer garantia de desempenho no futuro.


Preço
Desde 03/01/2025
638.03K
Volume negociado
21.34K
Pips ganhos
15
Vendas