
Descrição
Apresentando o Indicador Canal de Desvio Padrão para cTrader, uma ferramenta poderosa projetada para ajudá-lo a visualizar as tendências do mercado com precisão.
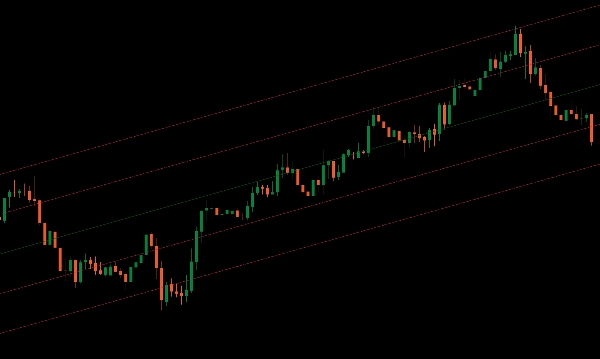
Este indicador exibe a mediana de um período especificado no seu gráfico, fornecendo um ponto de referência central para os movimentos de preço.
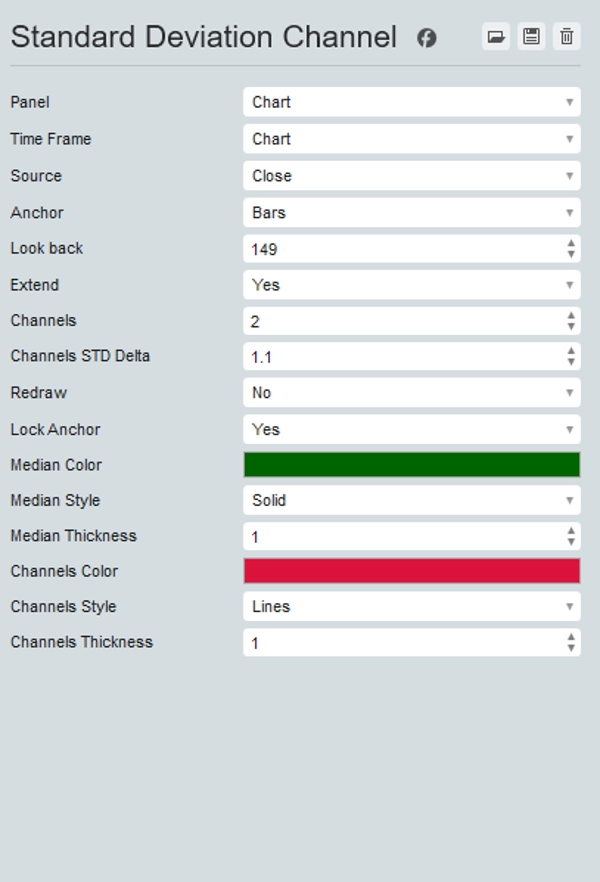
Além disso, permite adicionar um número desejado de canais superiores e inferiores em múltiplos do desvio padrão, oferecendo uma visão clara da volatilidade do preço e das potenciais zonas de rompimento.
Perfeito para traders que buscam capacidades analíticas aprimoradas, o indicador Canal de Desvio Padrão ajuda a identificar direções de tendência e potenciais pontos de reversão com facilidade.
Atualize seu conjunto de ferramentas de negociação com o Canal de Desvio Padrão para uma análise de mercado superior e tomada de decisão aprimorada.
Resumo
Avaliações de clientes
5 | 100 % | |
4 | 0 % | |
3 | 0 % | |
2 | 0 % | |
1 | 0 % |


