
support and resistance
Indicador
13 compras
Versão 1.0, Jun 2025
Windows, Mac
4.3
Avaliações: 3
Principais Características:
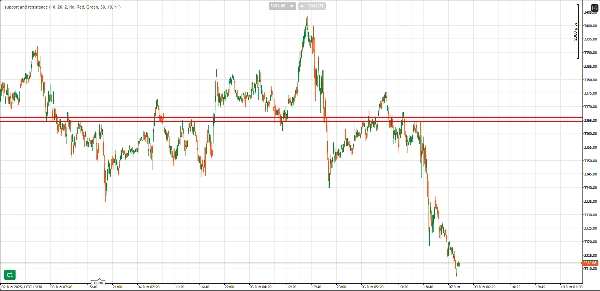
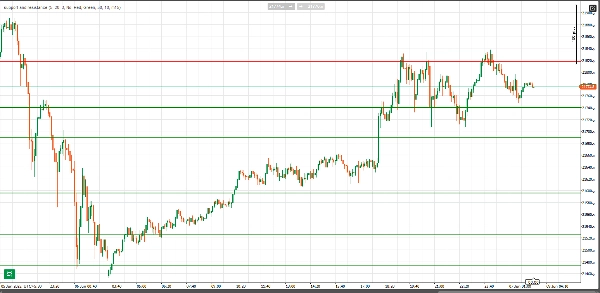
- Detecção Automática de Suporte e Resistência: O indicador identifica automaticamente níveis significativos de suporte e resistência com base na ação do preço, destacando essas zonas onde o preço reverteu ou parou várias vezes.
- Validação da Contagem de Rebatidas: Os níveis de suporte e resistência são validados com base no número de rebatidas (reações do preço) a partir do nível. Quanto mais rebatidas, mais forte é o nível. Você pode ajustar a contagem mínima de rebatidas para que um nível seja considerado válido, garantindo que apenas níveis altamente significativos sejam marcados.
- Estilos de Linha Ajustáveis: A espessura e o estilo das linhas de suporte e resistência são ajustados automaticamente com base na contagem de rebatidas. Níveis com mais rebatidas são desenhados com linhas mais grossas e mais proeminentes, enfatizando visualmente sua importância.
- Largura da Zona (Pips): Você pode definir uma zona de buffer ao redor dos níveis de suporte e resistência em pips. Isso ajuda a identificar a ação do preço dentro de uma faixa onde o preço pode potencialmente reverter ou reagir.
- Filtro de Timeframe Superior: Uma característica única deste indicador é sua capacidade de validar níveis de suporte e resistência usando um filtro de timeframe superior. Ao selecionar um timeframe superior (por exemplo, 1H, 4H), o indicador verifica os níveis identificados em relação à ação de preço chave no timeframe superior, garantindo que apenas níveis significativos sejam desenhados no gráfico.
- Alertas: Quando o preço entra na zona de um nível de suporte ou resistência, o indicador pode alertá-lo com um som de áudio, para que você nunca perca uma reação importante do preço.
- Cores Personalizáveis: Você pode facilmente alterar a cor das linhas de suporte e resistência para adequar às suas preferências ou alinhar com o tema do seu trading.
- Prevenção de Sobreposição: O indicador inclui um filtro de limiar que impede o desenho de níveis de suporte e resistência sobrepostos que estejam muito próximos uns dos outros, garantindo que apenas níveis únicos e importantes sejam exibidos.
Benefícios:
- Economize Tempo: Detecte e visualize automaticamente os principais níveis de suporte e resistência sem desenhá-los manualmente.
- Visuais Claros: Veja facilmente quais níveis de suporte e resistência são os mais significativos com base nas rebatidas do preço e na validação de timeframe superior.
- Alertas Eficazes: Receba alertas oportunos quando a ação do preço entrar em níveis importantes, ajudando você a agir rápida e eficientemente.
- Decisões de Trading Melhoradas: Use este indicador para ganhar mais confiança em suas entradas e saídas, bem como em sua análise técnica geral.
Opções de Personalização:
- Barras de Retrospectiva: Ajuste o quão longe o indicador olha para trás para identificar potenciais níveis de suporte e resistência.
- Rebatidas Mínimas: Defina o número mínimo de rebatidas necessárias para que um nível seja considerado válido.
- Timeframe Superior: Filtre níveis de suporte e resistência com base em um timeframe superior (por exemplo, gráficos de 1 hora, 4 horas).
- Cor da Linha: Escolha cores para as linhas de resistência e suporte para adequar ao estilo do seu gráfico.
- Configurações de Alerta: Ative ou desative alertas com base na entrada do preço nas zonas de suporte ou resistência.
Perfil do indicador
Categoria do indicador
Suporte e resistência
Tipo de resultado
Visualização
Requisitos de dados
Apenas barras
Sinais suportados
Quebra
Inversão
4.3
Avaliações: 3
5 | 33 % | |
4 | 67 % | |
3 | 0 % | |
2 | 0 % | |
1 | 0 % |
Avaliações de clientes
June 11, 2025
Nice setup companion for a more controlled workflow. It helps with planning entries and exits around important areas, but not every zone holds, even if it looks clean. The cleanest use is 3 to 5 levels per chart, with 0.5 pullbacks checked before entry. I would still keep manual review in the process.
June 10, 2025
June 10, 2025
Decent option for checks around key price zones. The useful part is planning entries and exits around important areas, with the numbers checked before scaling. I would wait for 2 reactions and avoid trades where the target is less than 1.5R. Levels are useful when they reduce noise, not when they crowd the chart.
BTCUSD
Prop
Forex
Breakout
Indices
EURUSD
Commodities
GBPUSD
NZDUSD
XAUUSD
NAS100
USDJPY
Os produtos disponíveis através da cTrader Store, incluindo bots de negociação, indicadores e plugins, são fornecidos por programadores terceiros e são disponibilizados apenas para fins informativos e de acesso técnico. A cTrader Store não é um corretor e não fornece aconselhamento em matéria de investimento, recomendações pessoais ou qualquer garantia de desempenho no futuro.


Desde 30/05/2025
40
Vendas