
Stochastic Momentum Index
Chỉ báo
1 lượt mua
Phiên bản 2.1, Jan 2026
Windows, Mac
4.5
Đánh giá: 2
Kể từ 31/01/2025
415.05M
Khối lượng đã giao dịch
2.69M
Pip đạt được
4
Lượt bán
187
Cài đặt miễn phí
Mô tả
Chỉ số Động lượng Ngẫu nhiên (SMI) là một bộ dao động ngẫu nhiên tinh chỉnh được thiết kế để đo động lượng mượt mà hơn so với Stochastic cổ điển. Triển khai cTrader này phù hợp với công thức thường dùng trên TradingView bằng cách áp dụng làm mượt EMA kép cho cả phạm vi tương đối và phạm vi cao-thấp, tạo ra một đường cong động lượng sạch, ổn định hoạt động tốt trong cả điều kiện xu hướng và dao động.
Nó hiển thị gì
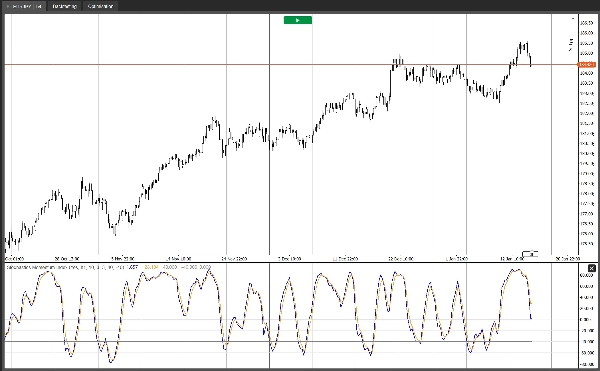
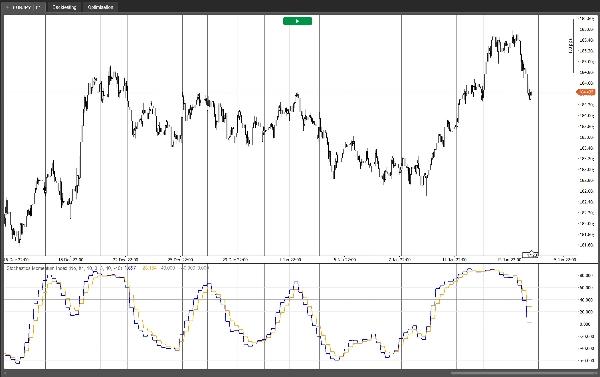
- SMI đo vị trí đóng cửa so với điểm giữa của phạm vi cao-thấp gần đây, được chuẩn hóa và tỷ lệ hóa.
- Giá trị thường dao động giữa -100 và +100.
- Các mức tham chiếu quá mua/quá bán (mặc định +40 / -40) giúp xác định các điều kiện kéo căng và cực điểm động lượng.
Biểu đồ
- SMI: đường động lượng chính.
- EMA dựa trên SMI: một đường tín hiệu (EMA của SMI) dùng để giao cắt và xác nhận.
- Các mức Quá mua / Quá bán / Trung tâm (0) để cung cấp bối cảnh trực quan nhanh.
Cách các nhà giao dịch sử dụng
- Chế độ xu hướng: Sử dụng đường 0 làm bộ lọc hướng (trên 0 = áp lực tăng, dưới 0 = áp lực giảm) và giao dịch các đợt hồi bằng cách dựa vào giao cắt giữa SMI và đường tín hiệu theo hướng xu hướng.
- Chế độ hồi quy trung bình: Giảm các cực điểm khi SMI trở lại từ trạng thái quá mua/quá bán và xác nhận bằng một giao cắt, thường nhắm đến đường 0 như mục tiêu hồi quy trung bình đầu tiên.
- Phân kỳ: Phân kỳ động lượng giữa giá và SMI có thể làm nổi bật các dao động có khả năng suy yếu.
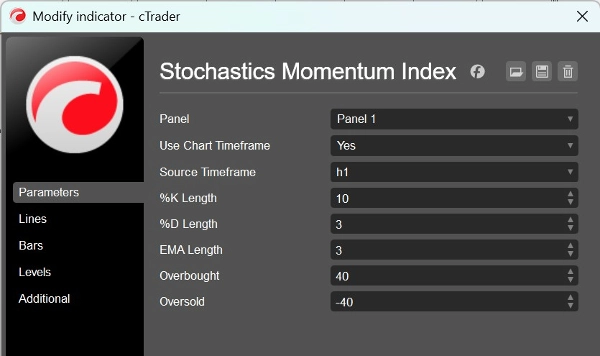
Tùy chọn đa khung thời gian
- Chọn Khung Thời gian Nguồn để tính SMI từ khung thời gian cao hơn trong khi hiển thị trên biểu đồ hiện tại (lý tưởng để lọc nhiễu và cải thiện chất lượng tín hiệu).
- Hoặc bật Sử dụng Khung Thời gian Biểu đồ để giữ tính toán trên khung thời gian hiện tại.
Các tham số đầu vào
- Độ dài %K: cửa sổ nhìn lại cho giá cao nhất / thấp nhất.
- Độ dài %D: độ dài làm mượt dùng trong tính toán EMA kép.
- Độ dài EMA: độ dài đường tín hiệu (EMA của SMI).
- Quá mua / Quá bán: các mức tham chiếu.
- Sử dụng Khung Thời gian Biểu đồ / Khung Thời gian Nguồn: tùy chọn tính toán trên khung thời gian cao hơn.
Chỉ báo này được xây dựng để nhẹ, ổn định và thực tế cho các quy trình giao dịch thực tế — dù bạn giao dịch tiếp diễn xu hướng, dao động hay sử dụng SMI như một bộ lọc xác nhận trong chiến lược rộng hơn.
Tóm tắt
Tóm tắt AI
The Stochastic Momentum Index (SMI) indicator for cTrader is a refined momentum oscillator that applies double EMA smoothing to both the relative range and high–low range, producing a smooth and stable momentum curve. It measures the position of the close price relative to the midpoint of the recent high–low range, with values oscillating between -100 and +100. Default overbought and oversold levels are set at +40 and -40, respectively, to highlight momentum extremes.
The indicator plots three key elements: the main SMI momentum line, an EMA-based signal line for crossovers and confirmation, and reference levels for overbought, oversold, and the zero midpoint. Traders use the zero line as a directional filter to identify bullish or bearish pressure and trade pullbacks via SMI and signal line crossovers. It also supports mean-reversion strategies by signaling fades from overbought/oversold conditions and can highlight momentum divergences.
A multi-timeframe option allows calculation of the SMI from a higher timeframe while displaying it on the current chart, helping to filter noise and improve signal quality. User inputs include lookback lengths for %K and %D, signal line EMA length, overbought/oversold levels, and timeframe selection. The indicator is designed for use across various markets including Forex, stocks, commodities, indices, and cryptocurrencies.
Hồ sơ chỉ báo
Đánh giá của khách hàng
4.5
Đánh giá: 2
5 | 50 % | |
4 | 50 % | |
3 | 0 % | |
2 | 0 % | |
1 | 0 % |
Đánh giá của khách hàng
January 28, 2026
The part worth keeping is the workflow feels calmer, and 2 swing checks is the line to watch.
January 23, 2026
it earns a spot because weak entries have a harder time slipping through, and spread and slippage need a line in the notes.
Thảo luận
Câu hỏi thường gặp
BTCUSD
Forex
Signal
Breakout
Indices
EURUSD
Commodities
GBPUSD
NZDUSD
Prop
Scalping
Crypto
Stocks
XAUUSD
NAS100
USDJPY
Các sản phẩm có sẵn trên cTrader Store, bao gồm bot giao dịch, chỉ báo và plugin, được cung cấp bởi các nhà phát triển bên thứ ba và chỉ nhằm mục đích cung cấp thông tin và tiếp cận kỹ thuật. cTrader Store không phải là nhà môi giới và không cung cấp lời khuyên đầu tư, khuyến nghị cá nhân hay bất kỳ đảm bảo nào về hiệu suất trong tương lai.
Sản phẩm khác của tác giả này


Giá
Kể từ 31/01/2025
415.05M
Khối lượng đã giao dịch
2.69M
Pip đạt được
4
Lượt bán
187
Cài đặt miễn phí