RegressionChannelV2
Indicateur
Version 1.0, Jan 2026
Windows, Mac
5.0
Avis : 1
Depuis le 31/01/2025
415.05M
Volume tradé
2.69M
Pips gagnés
4
Ventes
187
Installations gratuites
Description
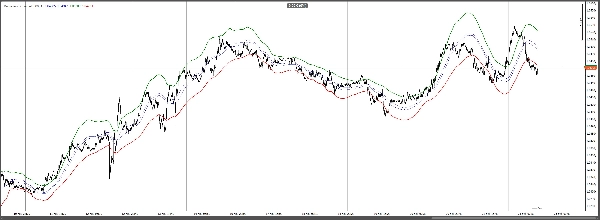
Le canal de régression est un outil visuel de tendance et de volatilité qui trace un canal lisse autour du prix. Il calcule des limites supérieures et inférieures adaptatives basées sur le comportement récent du marché, vous aidant à repérer rapidement la direction dominante, à mesurer l'expansion/la contraction de la volatilité et à identifier les mouvements potentiellement excessifs.
Utilisez-le pour :
- Confirmer la direction et la force de la tendance
- Mettre en évidence les zones de retour à la moyenne près des bords du canal
- Repérer les cassures lorsque le prix dépasse la limite
- Améliorer les entrées/sorties en combinant avec vos signaux existants
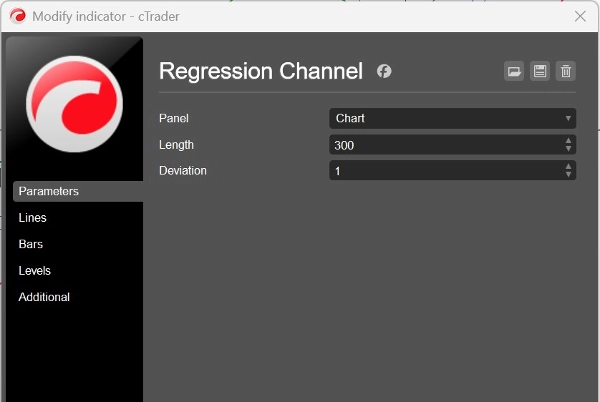
Paramètres :
- Longueur : fenêtre de retour utilisée pour le calcul du canal
- Déviation : multiplicateur de largeur de bande contrôlant la largeur du canal
Résumé
Profil de l'indicateur
Avis clients
5.0
Avis : 1
5 | 100 % | |
4 | 0 % | |
3 | 0 % | |
2 | 0 % | |
1 | 0 % |
Avis clients
January 24, 2026
Messy entries become more obvious, but the market context still matters.
Discussion
Questions fréquentes
BTCUSD
Forex
Signal
Breakout
Indices
EURUSD
Commodities
GBPUSD
NZDUSD
Prop
Scalping
Crypto
Stocks
XAUUSD
NAS100
USDJPY
Les produits disponibles sur cTrader Store, notamment les bots de trading, les indicateurs et les plug-ins, sont fournis par des développeurs tiers et mis à disposition à titre informatif et à des fins d'accès technique uniquement. cTrader Store n'est pas un courtier et ne fournit aucun conseil en investissement, aucune recommandation personnelle ni aucune garantie quant aux performances futures.
Plus de cet auteur


Prix
Depuis le 31/01/2025
415.05M
Volume tradé
2.69M
Pips gagnés
4
Ventes
187
Installations gratuites