
Description
ICT Killzones Complete – Analyse professionnelle des sessions de trading
Maîtrisez le timing du trading institutionnel avec l'indicateur ICT Killzones le plus complet pour cTrader. Cet outil de qualité professionnelle identifie et visualise automatiquement les cinq sessions de trading ICT (Inner Circle Trader) critiques, vous donnant l'avantage de trader aux côtés des smart money.
Nouveautés de cette version :
- Toutes les 5 sessions ICT : Couverture complète incluant la plage asiatique, la London Kill Zone, la New York Kill Zone, la zone déjeuner/inversion NY, et la NY PM Kill Zone
- Système de couleurs intelligent : Noms de couleurs simples (Rouge, Bleu, Orange) au lieu de codes ARGB complexes
- Contrôles de transparence indépendants : Ajustez l'opacité pour chaque session (0-100%)
- Couleurs d'étiquettes spécifiques à chaque session : Personnalisez les couleurs des étiquettes indépendamment des couleurs des zones
- Descriptions des sessions : Étiquettes d'information optionnelles expliquant les caractéristiques de chaque session
- Performance améliorée : Code optimisé avec nettoyage automatique des anciennes zones
Fonctionnalités clés :
📊 Couverture complète des sessions :
- Plage asiatique (19:00-00:00 NY) : Identifie les zones de consolidation et les pools de liquidité pour des raids ultérieurs
- London Kill Zone (02:00-05:00 NY) : Marque les pics majeurs de volatilité idéaux pour les chasses aux stops et les retournements
- NY Kill Zone (07:00-10:00 NY) : Met en évidence le deuxième mouvement majeur avec un fort élan
- Zone déjeuner NY (12:00-13:30 NY) : Montre les périodes de retournement et de consolidation
- NY PM Kill Zone (13:30-16:00 NY) : Capture les mouvements secondaires et le rééquilibrage du marché
🎨 Personnalisation facile des couleurs :
- Noms de couleurs simples : tapez simplement "Bleu", "Orange", "Violet", etc.
- Plus de 50 couleurs prédéfinies incluant DodgerBlue, BlueViolet, MediumAquamarine
- Support des couleurs hexadécimales (format #RRGGBB)
- Curseurs de transparence individuels (0-100%) pour chaque zone
- Couleurs d'étiquettes séparées pour une clarté maximale
⚙️ Options d'affichage puissantes :
- Activez/désactivez les sessions individuellement
- Afficher/masquer les étiquettes d'information des sessions
- Taille de police ajustable (6-20)
- Étendez les zones jusqu'au bord du graphique ou gardez-les contenues
- Contrôlez le nombre de jours d'historique affichés (1-30 jours)
- Le nettoyage automatique évite l'encombrement du graphique
🎯 Design professionnel :
- Visualisation propre et non intrusive
- Suivi dynamique des plus hauts/bas pendant les sessions actives
- Gestion appropriée des sessions de nuit
- Fonctionne sur toutes les unités de temps
- Aucun décalage, performance optimisée
Idéal pour :
- Les traders utilisant la méthodologie ICT recherchant un timing précis
- Les traders smart money suivant les flux institutionnels
- Les day traders et scalpers nécessitant des limites de session exactes
- Les swing traders identifiant les zones clés de retournement
- Toute personne souhaitant aligner ses trades avec les principales sessions de marché
Comment ça fonctionne :
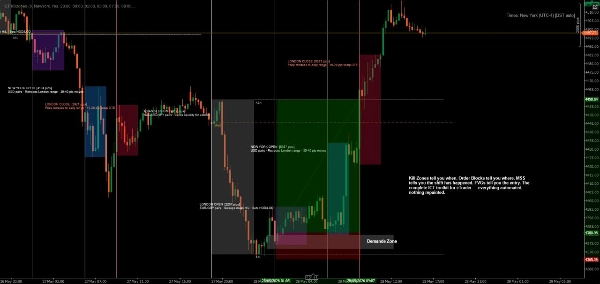
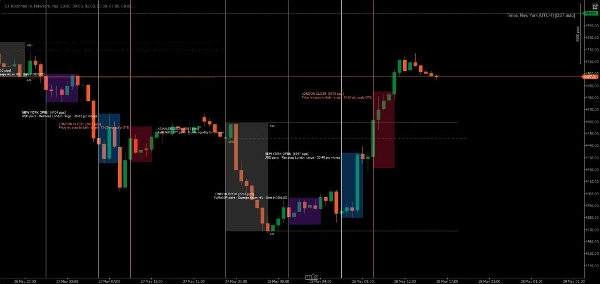
L'indicateur détecte automatiquement chaque jour de trading et crée des zones codées par couleur pour les cinq sessions ICT. Au fur et à mesure que le prix évolue dans chaque session, l'indicateur suit le plus haut et le plus bas, puis trace la zone finale lorsque la session se termine. Les étiquettes identifient clairement chaque session et affichent optionnellement ses caractéristiques de trading.
Tous les horaires sont en heure de New York (heure de l'Est), suivant la méthodologie ICT standard.
Exemples de personnalisation :
- Configuration conservatrice : Transparence faible (20-30%), couleurs subtiles, pas d'info session
- Configuration audacieuse : Transparence élevée (70-80%), couleurs vives, descriptions complètes des sessions
- Configuration minimale : Désactivez les sessions non désirées, ne gardez que vos killzones préférées
- Stratégie codée par couleur : Associez les couleurs des zones à votre biais de trading (vert = long, rouge = short)
Configuration requise :
- Plateforme : cTrader Desktop (les produits du cTrader Store ne sont pas pris en charge sur les versions Web ou Mobile) blog.ctrader.com
- Système d'exploitation : Windows 7 ou supérieur
- Processeur : CPU double cœur recommandé
- Mémoire : Minimum 2 Go de RAM (4 Go recommandés)
- Connexion Internet : 50 kB par seconde ou plus rapide
Instructions d'installation :
- Acheter/Installer : Obtenez l'indicateur depuis le cTrader Store
- Télécharger cTrader Desktop : Si ce n'est pas déjà fait, téléchargez depuis ctrader.com
- Se connecter : Ouvrez cTrader Desktop et connectez-vous avec votre identifiant cTrader
- Accéder à l'indicateur : Naviguez vers la section "Algo" → liste "Indicators"
- Ajouter au graphique : Clic droit sur n'importe quel graphique → "Indicators" → Sélectionnez "ICT Killzones Complete"
- Personnaliser : Clic droit sur le nom de l'indicateur sur le graphique → "Settings" pour ajuster les couleurs, horaires et options d'affichage
Conseils pour de meilleurs résultats :
- Utilisez sur des unités de temps de 1 minute à 1 heure pour une visibilité optimale
- Combinez avec l'action des prix et les concepts de liquidité pour de meilleurs résultats
- Ajustez les horaires des sessions si votre courtier utilise des fuseaux horaires différents
- Expérimentez avec la transparence pour trouver votre équilibre visuel parfait
- Activez les étiquettes d'info session lors de l'apprentissage, désactivez-les pour des graphiques plus épurés
Tradez avec précision. Tradez avec confiance. Tradez à la manière ICT.
Note : Cet indicateur est à des fins éducatives et informatives. Les performances passées ne garantissent pas les résultats futurs. Pratiquez toujours une gestion appropriée des risques.
Résumé
The indicator tracks high and low prices during active sessions and finalizes zones upon session close, providing clear visual boundaries for institutional trading timing. It supports all timeframes, handles overnight sessions properly, and includes automatic cleanup of old zones to maintain chart clarity. Customization options include font size adjustment, zone extension control, and history length for displayed zones. ICT Killzones Complete is suitable for traders using ICT methodology, smart money concepts, scalping, day trading, and swing trading across markets such as Forex, commodities, and crypto. It requires cTrader Desktop on Windows 7 or higher with recommended hardware specifications.
Avis clients
5 | 50 % | |
4 | 25 % | |
3 | 0 % | |
2 | 25 % | |
1 | 0 % |


