
Consolidation Zones
Indicateur
1 achats
Version 1.0, Oct 2025
Windows, Mac
4.0
Avis : 1
Description
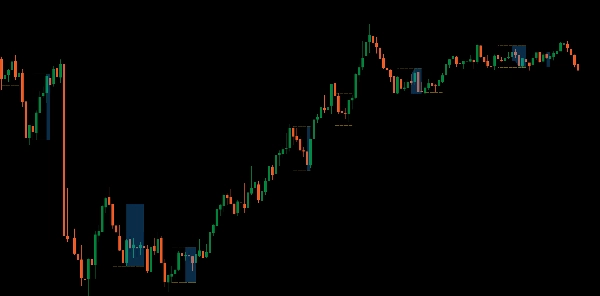
Présentation de l'indicateur Zones de Consolidation, conçu pour vous aider à identifier et à tirer parti des opportunités de rupture en toute simplicité.
Cet outil puissant met en évidence les zones sur votre graphique où le prix se consolide, facilitant ainsi la détection des points de rupture potentiels. En visualisant ces zones critiques, vous pouvez mieux anticiper les mouvements du marché et prendre des décisions de trading plus éclairées.
Idéal pour les traders souhaitant améliorer leur stratégie avec des informations claires et exploitables, améliorez votre boîte à outils de trading et maîtrisez les ruptures avec l'indicateur Zones de Consolidation.
Résumé
Résumé IA
The Consolidation Zones indicator identifies and visualizes price consolidation areas on trading charts to help traders spot potential breakout points. By highlighting these zones, it assists in anticipating market movements and supports more informed decision-making. This tool is applicable across multiple markets, including Forex, cryptocurrencies (e.g., BTCUSD), commodities (e.g., gold, oil), indices (e.g., NAS100, SP500), and stocks. It is designed to enhance trading strategies focused on breakout opportunities by providing clear visual cues of consolidation phases.
Profil de l'indicateur
Avis clients
4.0
Avis : 1
5 | 0 % | |
4 | 100 % | |
3 | 0 % | |
2 | 0 % | |
1 | 0 % |
Avis clients
October 12, 2025
Two timeframes give more context, and the log becomes easier to read.
Discussion
Questions fréquentes
BTCUSD
Forex
Breakout
Indices
EURUSD
Commodities
GBPUSD
NZDUSD
Prop
Crypto
Stocks
XAUUSD
NAS100
USDJPY
Les produits disponibles sur cTrader Store, notamment les bots de trading, les indicateurs et les plug-ins, sont fournis par des développeurs tiers et mis à disposition à titre informatif et à des fins d'accès technique uniquement. cTrader Store n'est pas un courtier et ne fournit aucun conseil en investissement, aucune recommandation personnelle ni aucune garantie quant aux performances futures.


Prix
Depuis le 25/09/2025
25
Ventes
315
Installations gratuites