
Simple ICT Concepts
Индикатор
3 покупки
Версия 1.0, Dec 2025
Windows, Mac
4.0
Отзывы: 1
Описание
Индикатор Simple ICT Concepts — это мощный инструмент, предназначенный для помощи трейдерам в применении принципов методологии Inner Circle Trader (ICT). Этот индикатор сосредоточен на выявлении ключевых зон, таких как уровни ликвидности, поддержки и сопротивления, а также структуры рынка, что делает его незаменимым активом для трейдеров, работающих с ценовым действием и концепцией умных денег.
Ключевые особенности
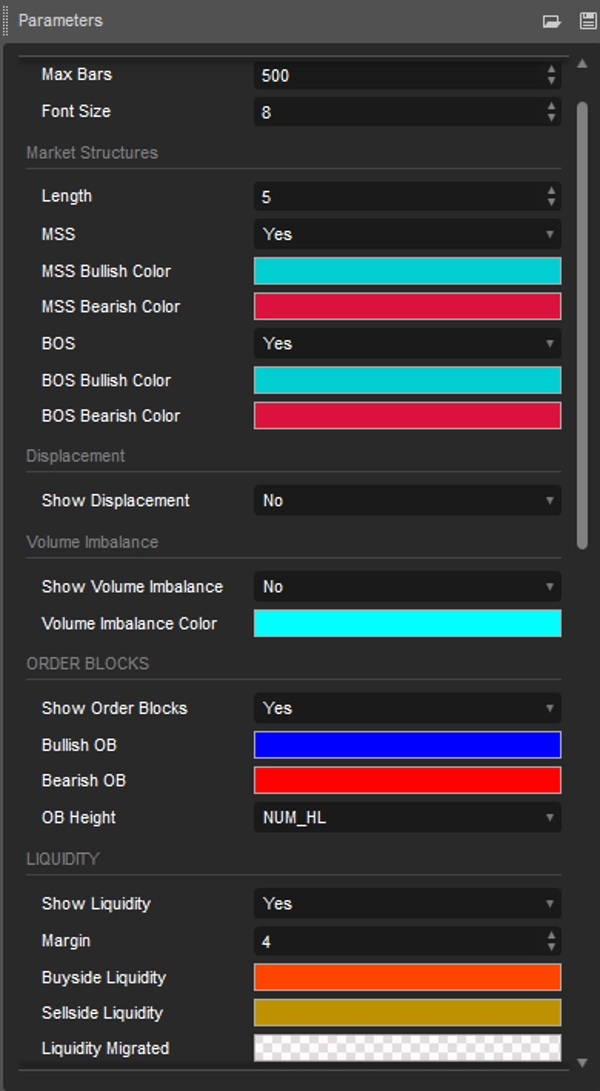
Структура рынка:
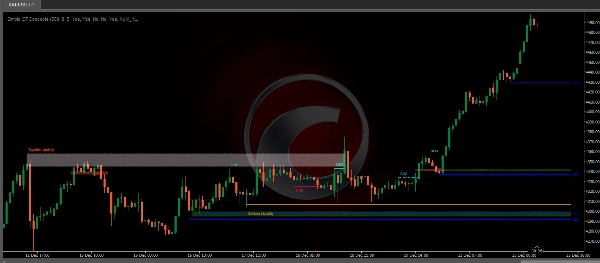
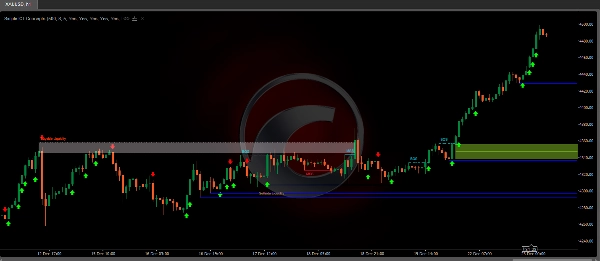
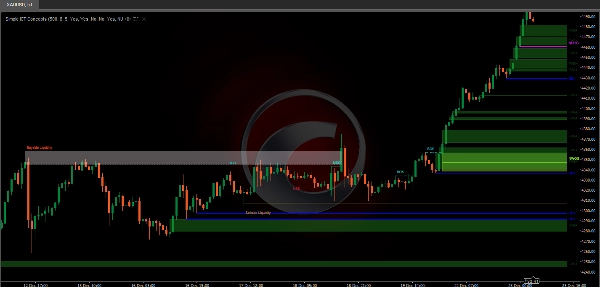
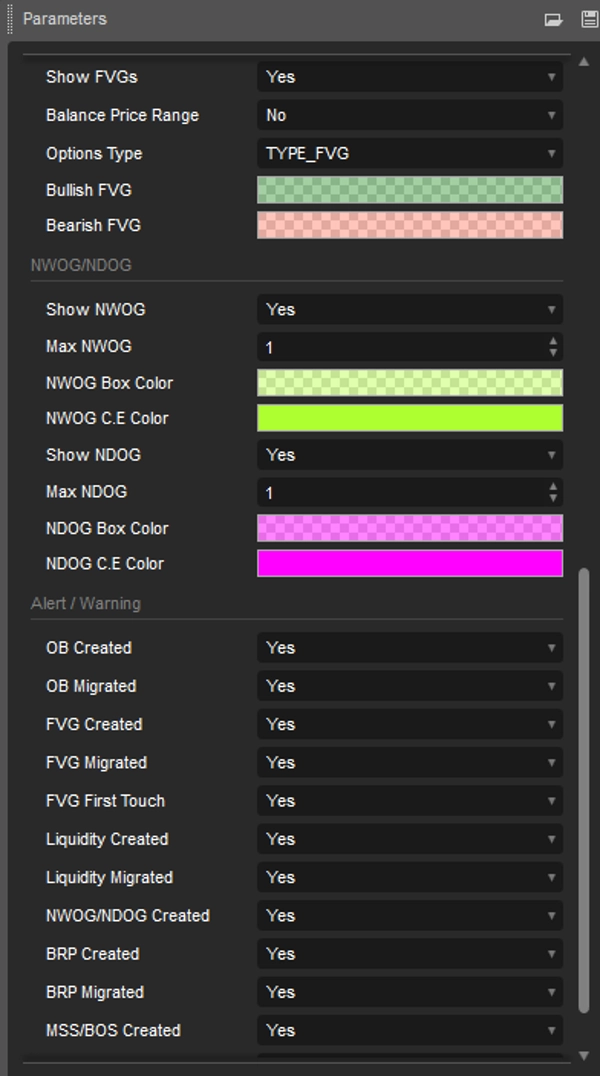
Метки структуры рынка строятся на основе пробоя предыдущей точки разворота цены. Это позволяет пользователю определить текущий рыночный тренд, основываясь на ценовом действии.Включены два типа меток структуры рынка:Сдвиг структуры рынка (MSS)Пробой структуры (BOS)MSS происходит, когда цена пробивает минимум колебания в восходящем тренде или максимум колебания в нисходящем тренде, указывая на возможный разворот.Часто это обозначается как "CHoCH", но ICT определяет это как MSS. С другой стороны, метки BOS появляются, когда цена пробивает максимум колебания в восходящем тренде или минимум колебания в нисходящем тренде.Появление этих конкретных точек разворота вызвано откатами (индукциями), которые подчеркивают охоту за ликвидностью на младших таймфреймах.Ключевые точки разворота: Более высокие максимумы (HH) и более низкие минимумы (LL), более высокие минимумы (HL) и более низкие максимумы (LH)Смещение:Смещения — это ситуации, когда цена формирует последовательные свечи с одинаковым настроением (бычьим/медвежьим) с большими телами и короткими тенями.Технически их можно определить по положительной автокорреляции (изменение закрытия к открытию с большей вероятностью сопровождается изменением того же знака), а также по кластеризации волатильности (крупные изменения следуют за крупными изменениями).Смещения могут быть причиной формирования дисбалансов, а также структуры рынка, которые могут быть вызваны полной реализацией мета-заказа.Дисбаланс объема:Дисбаланс объема (V.I.) возникает, когда существует область цены, оставшаяся без тела свечи. В области пересечения теней наблюдаются движения вверх и вниз, однако, поскольку основная часть объема сосредоточена в теле свечи, мы называем это дисбалансом объема.Блоки ордеров:Блок ордеров ICT (Inner Circle Trader) — это ценовая зона на графике, где крупные институциональные инвесторы размещают значительные ордера на покупку или продажу. Блоки ордеров являются ключевой концепцией в трейдинге, так как помогают трейдерам выявлять потенциальные уровни поддержки и сопротивления, а также предсказывать развороты цены.Ликвидность:Уровни ликвидности с покупательской и продавательской стороны выделяют ценовые уровни, где участники рынка могут размещать лимитные/стоп-ордера.Уровни покупательской ликвидности объединяют стоп-лоссы коротких позиций и лимитные ордера длинных позиций, в то время как уровни продавательской ликвидности объединяют стоп-лоссы длинных позиций и лимитные ордера коротких позиций.Эти уровни могут играть разные роли. Более информированные участники рынка могут рассматривать эти уровни как источник ликвидности, и когда ликвидность на определенном уровне уменьшается, она будет найдена в другой области.FVG/IFVG:Разрывы справедливой стоимости: Формирование из трех свечей, где тени свечей, прилегающих к центральной свече, не перекрываются, что выделяет область разрыва.Предполагаемые разрывы справедливой стоимости: В отличие от разрыва справедливой стоимости, предполагаемый разрыв имеет перекрывающиеся тени свечей, прилегающих к центральной свече. Область разрыва формируется на основе среднего значения между соответствующей тенью и ближайшей границей тела свечи.Сбалансированный ценовой диапазон: Сбалансированные ценовые диапазоны возникают, когда разрыв справедливой стоимости перекрывает предыдущий разрыв справедливой стоимости, при этом область перекрытия образует зону дисбаланса.NWOG/NDOG:Этот индикатор отображает разрывы открытия новой недели (NWOG) и разрывы открытия нового дня (NDOG). NWOG — это разрыв между ценой закрытия пятницы и ценой открытия воскресенья. NDOG — это разрыв между ценой открытия и закрытия предыдущего дня.
Настраиваемые функции
Пользователи могут настраивать параметры, такие как длина данных, цвета и стили отображения, чтобы соответствовать своим торговым предпочтениям.
Преимущества для трейдеров
Экономит время на ручном анализе, повышая эффективность торговли.
Помогает принимать быстрые и обоснованные решения в условиях волатильного рынка.
Прост в использовании как для новичков, так и для опытных трейдеров.
Заключение
Индикатор Simple ICT Concepts — это не просто инструмент, а комплексное решение для трейдеров, стремящихся эффективно применять стратегии ICT. Это надежный выбор для улучшения анализа рынка и точного исполнения сделок.
Сводка
ИИ-сводка
The Simple ICT Concepts Indicator is a technical analysis tool designed to assist traders in applying the Inner Circle Trader (ICT) methodology. It identifies key market zones including liquidity levels, support and resistance, and market structure to support price action and smart money concept trading. The indicator labels market structure shifts (MSS) and breaks of structure (BOS) based on swing point breaks, helping users determine current market trends. It detects displacements characterized by successive candles with strong directional sentiment, volume imbalances where candle bodies leave gaps, and order blocks representing institutional buy or sell zones. The tool highlights buy-side and sell-side liquidity levels, indicating where stop-loss and limit orders cluster. It also identifies fair value gaps (FVG), implied fair value gaps (IFVG), balanced price ranges, and new week/day opening gaps (NWOG/NDOG). Users can customize settings such as data length, colors, and display styles to fit their trading preferences. The indicator aims to save time on manual analysis and facilitate quick, informed decisions in volatile markets. It is suitable for both beginners and experienced traders seeking to implement ICT strategies effectively across markets including Forex, cryptocurrencies, and indices like BTCUSD, XAUUSD, and NAS100.
Профиль индикатора
Отзывы покупателей
4.0
Отзывы: 1
5 | 0 % | |
4 | 100 % | |
3 | 0 % | |
2 | 0 % | |
1 | 0 % |
Отзывы покупателей
December 27, 2025
The signal still needs a chart check, no surprise there. One green trade proves nothing.
Обсуждение
Частые вопросы
BTCUSD
Forex
Signal
Fair Value Gap
Crypto
XAUUSD
NAS100
Продукты, доступные в cTrader Store, включая торговых ботов, индикаторы и плагины, предоставляются сторонними разработчиками и доступны исключительно в информационных и технических целях. cTrader Store не является брокером и не предоставляет инвестиционные консультации, персональные рекомендации или какие-либо гарантии будущей доходности.


![Логотип продукта "[Hamster-Coder] Pivot Points MTF"](https://cdn.ctrader.com/image/webp/4c143e5a-309c-40e3-a578-f04d1e133ffa_31159)


Цена
38
Продажи
2.39K
Бесплатные установки