
Description
Profil de volume de session HD
Ce que cela fait
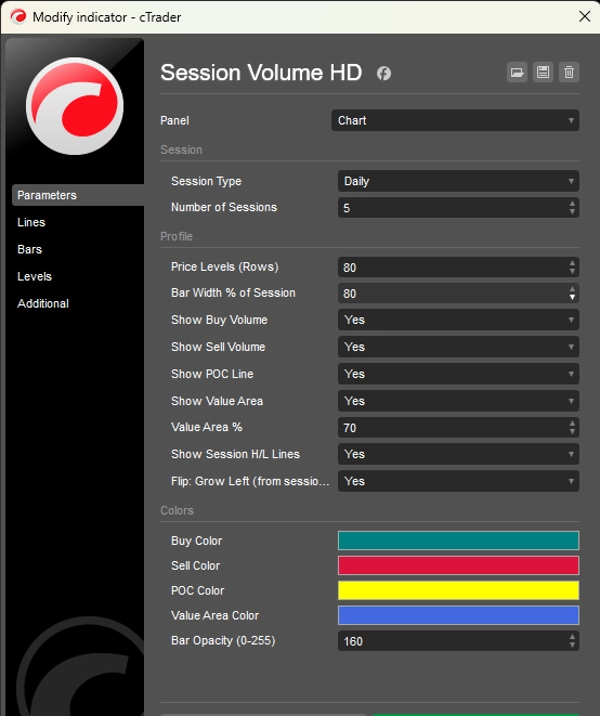
Affiche un profil de volume horizontal pour chaque session de trading directement sur le graphique. Il montre comment le volume des échanges est réparti entre les niveaux de prix, aidant les traders à identifier les zones d'activité élevée, les zones de juste valeur et les niveaux clés de support/résistance dérivés uniquement du comportement du volume.
Comment ça fonctionne
À la clôture de chaque nouvelle barre, l'indicateur analyse toutes les barres dans le nombre défini de sessions et répartit le volume de ticks de chaque barre sur sa plage de prix. Le volume est divisé en côté achat (barres haussières) et côté vente (barres baissières) en utilisant la direction d'ouverture/fermeture de la barre comme proxy. Le résultat est rendu sous forme d'un histogramme horizontal en couches ancré à la limite temporelle de la session.
Éléments visuels
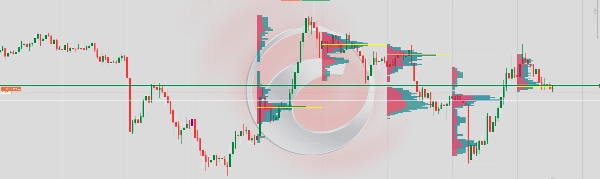
Barres d'achat (Sarcelle) — Montrent le volume échangé lors des mouvements de prix haussiers à chaque niveau. Elles s'étendent vers la gauche (ou vers la droite si inversées) depuis l'ancre de la session.
Barres de vente (Rouge) — Montrent le volume échangé lors des mouvements de prix baissiers à chaque niveau, empilées à côté des barres d'achat.
Ligne POC (Jaune) — Point de Contrôle. Une ligne horizontale marquant le niveau de prix avec le volume total le plus élevé dans la session. Agit comme un aimant pour le prix.
Zone de valeur (Superposition bleue) — La plage de prix contenant un pourcentage configurable (70 % par défaut) du volume total de la session. Représente la zone de « juste valeur » où la majorité des échanges ont eu lieu.
Lignes H/L de session (Pointillées blanches) — Marquent le prix le plus haut et le plus bas atteint durant la session.
Performance
L'indicateur redessine une seule fois par nouvelle barre, pas à chaque tick. Cela élimine le scintillement et assure un rendu stable même avec de nombreuses sessions et un grand nombre de niveaux de prix.
Limitations
Comme cTrader n'expose pas le volume réel bid/ask au niveau de la barre sans un flux de données tick, le volume achat/vente est approximé en utilisant la direction de la barre : les barres haussières sont pondérées à 65 % achat / 35 % vente, les barres baissières inversement, et les barres doji sont réparties 50/50. Pour un volume delta réel, un abonnement aux données tick serait nécessaire.


![Logo de "Wyckoff Toolkit [Iridio Capital]"](https://cdn.ctrader.com/image/webp/8acfe6a1-6a8e-4578-9367-9df3af2b1801_27763)


