
Описание
SR COMMANDER — Многофреймовое издание
Смотрите, где крупные деньги проводят черту. Торгуйте на своем таймфрейме. Думайте на их.
Большинство инструментов поддержки и сопротивления привязаны к таймфрейму вашего графика. Если вы скальпируете на M1, ваши уровни S/R берутся из свечей M1 — маленьких, шумных и легко подделываемых. SR Commander MTF разрывает эту цепь.
Установите график на M1. Установите таймфрейм SR на H1. Теперь вы скальпируете с точностью минутного графика, но ваши уровни поддержки и сопротивления берутся из часовых свечей, где институциональные инвесторы, алгоритмы и профессиональные трейдеры действительно принимают решения. Вот в чем преимущество.
КАК РАБОТАЕТ МНОГОФРЕЙМОВЫЙ ДВИГАТЕЛЬ
Индикатор одновременно запускает два независимых потока данных.
Ваш таймфрейм графика контролирует то, что вы видите — ваши свечи, ваши входы, ваши стрелки, ваше время. Ваш таймфрейм SR контролирует, откуда берутся уровни. Эти два потока сопоставляются друг с другом в реальном времени, свеча за свечой. Когда закрывается новая свеча графика, SR Commander ищет правильную свечу таймфрейма SR для этого точного момента и пересчитывает уровни на основе структуры более высокого таймфрейма.
Это означает, что ваша зеленая линия поддержки и красная линия сопротивления всегда отражают структуру таймфрейма SR с учетом волатильности, а не шум графика, который вы смотрите.
НАУКА ЗА УРОВНЯМИ
SR Commander не просто рисует линии на максимумах и минимумах колебаний. Он использует модель волатильности Янга-Чжана — тот же класс оценщиков волатильности, который применяется в профессиональных количественных исследованиях — для вычисления истинного статистического веса каждой свечи. Каждый уровень выводится из нормализованной ценовой структуры с учетом ночных гэпов, движения от открытия до закрытия и внутрисвечного диапазона. В результате получаются уровни с реальным математическим значением, а не просто визуальной заметностью.
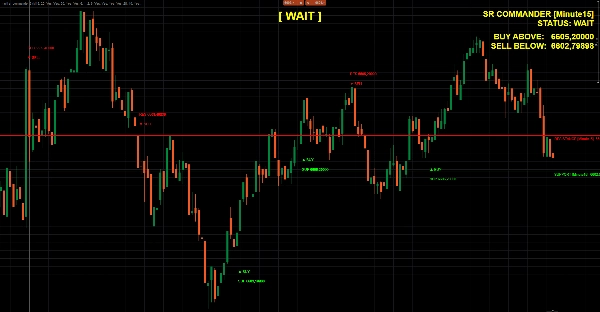
ЧТО ВЫ ВИДИТЕ НА ГРАФИКЕ
- 🟢 Зеленая линия поддержки — ближайший статистически значимый уровень поддержки ниже текущей цены, взятый из выбранного вами таймфрейма SR
- 🔴 Красная линия сопротивления — ближайший статистически значимый уровень сопротивления выше текущей цены, взятый из выбранного вами таймфрейма SR
- ⬆️ Сигнал на ПОКУПКУ — срабатывает, когда цена отскакивает от поддержки с подтвержденным бычьим закрытием свечи таймфрейма SR
- ⬇️ Сигнал на ПРОДАЖУ — срабатывает, когда цена отталкивается от сопротивления с подтвержденным медвежьим закрытием свечи таймфрейма SR
- 📊 Живая панель управления — показывает активный таймфрейм SR, текущий статус и точные цены срабатывания пробоя
- 🔵 Большая метка статуса — ПОКУПКА / ПРОДАЖА / ОЖИДАНИЕ, обновляется каждую свечу в верхней центральной части вашего графика
- 🕓 Исторический оверлей — отскоки, отказы, пробои и отступления отмечены на графике для мгновенной визуальной проверки
РАБОТАЮЩИЕ КОМБИНАЦИИ ТАЙМФРЕЙМОВ
Таймфрейм графикаТаймфрейм SRСлучай использования
M1
M5 или M15
Быстрый скальпинг с краткосрочной структурой
M5
H1
Внутридневная торговля с часовыми уровнями
M15
H4
Свинг-входы с 4-часовой структурой
H1
D1
Позиционная торговля на основе дневных уровней S/R
Любой
График
Классический режим — оригинальное поведение с одним таймфреймом
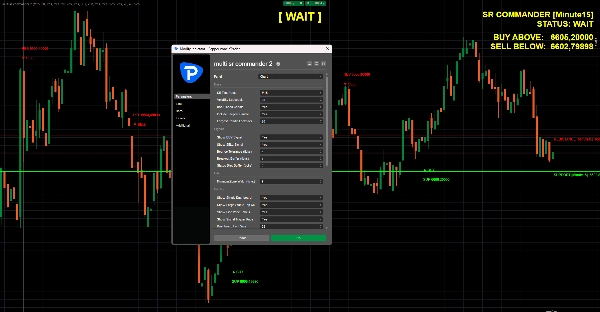
ФУНКЦИИ
- Полноценный многофреймовый движок — любой таймфрейм SR на любом таймфрейме графика
- Вычисление уровней с нормализацией волатильности по модели Янга-Чжана
- Включение самой большой свечи — всегда захватывает доминирующую структуру свечи за период обзора
- Логика сигналов отскока и отторжения с настраиваемой толерантностью и буфером
- Обнаружение пробоев и отступлений с регулируемым буфером
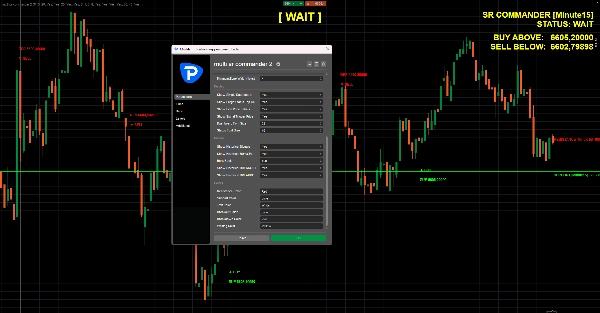
- Исторический оверлей сигналов для мгновенной проверки на графике
- Панель управления и большая метка статуса с полностью настраиваемыми размерами шрифтов и цветами
- Нулевой репейнт — все сигналы основаны на закрытых свечах при активном режиме подтверждения
ДЛЯ КОГО ЭТО?
Трейдеры, которые понимают, что лучшие входы происходят на более низких таймфреймах, а лучшие уровни — на более высоких. Если вы когда-либо вручную рисовали уровни H4, торгуя на M5 — SR Commander автоматизирует весь этот процесс, сохраняет математическую обоснованность и выводит сигнал прямо на ваш график в момент реакции цены.
Структура высокого таймфрейма. Точность низкого таймфрейма. Один индикатор.
Сводка
The indicator calculates S/R levels using the Yang-Zhang volatility model, which accounts for overnight gaps, open-to-close movement, and intrabar range to produce statistically significant levels rather than simple swing highs and lows. On the chart, it shows a green support line and a red resistance line representing the nearest significant levels below and above the current price from the chosen S/R timeframe.
Additional features include buy and sell signals triggered by price reactions to these levels confirmed on the S/R timeframe, a live dashboard displaying current status and breakout prices, a large status label indicating BUY, SELL, or WAIT, and historical overlays marking past bounces, rejections, and breakouts. The indicator supports various timeframe combinations suitable for scalping, intraday, swing, and position trading across markets including forex, indices, commodities, stocks, and crypto.
Отзывы покупателей
5 | 50 % | |
4 | 50 % | |
3 | 0 % | |
2 | 0 % | |
1 | 0 % |


