Описание
═══════════════════════════════════════════════════════════════
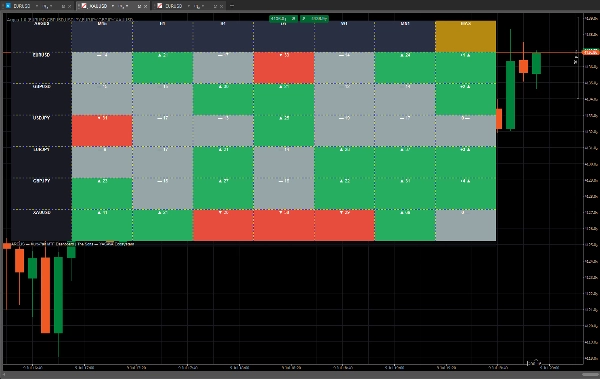
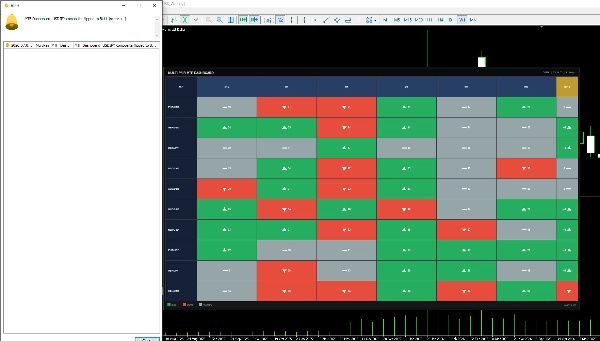
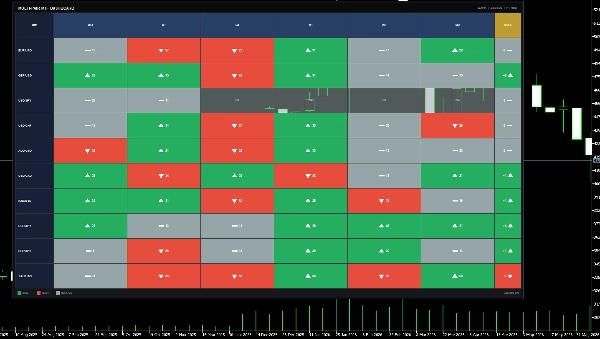
ARGUS — ПАНЕЛЬ МУЛЬТИ-ПАРНЫХ MTF
The Sons
═══════════════════════════════════════════════════════════════
Назван в честь Аргуса Паноптеса, сотноглазого стража из греческой мифологии,
который никогда не закрывал все глаза одновременно — эта панель следит
за 60 ячейками смещения по 10 символам и 6 таймфреймам одновременно,
без необходимости переключаться между вкладками графиков.
───────────────────────────────────────────────────────────────
ЧТО ОНА ДЕЛАЕТ
───────────────────────────────────────────────────────────────
Подтверждение тренда на разных таймфреймах обычно означает открытие
графика каждой пары и ручное переключение между M15, H1, H4, D1, W1 и MN1,
чтение наклона EMA, состояния MACD и силы ADX на каждом из них,
а затем повторение этого для следующего символа. Десять пар, шесть таймфреймов
каждый — это шестьдесят ручных проверок до того, как вы совершите сделку.
ARGUS выполняет всю эту проверку непрерывно в фоновом режиме и
отображает её в виде одной фиксированной сетки. Каждая ячейка оценивается
по 3-сигнальному голосованию (тренд EMA, импульс MACD, направление DI+/DI-) и фильтруется
по силе ADX, поэтому слабый или нестабильный рынок показывает нейтральный
сигнал вместо ложной стрелки. Каждая строка символов также сводится в
один составной показатель BIAS, так что полное согласование по таймфреймам
видно с первого взгляда — без прокрутки и переключения вкладок.
───────────────────────────────────────────────────────────────
ПАНЕЛЬ — ДО 10 СИМВОЛОВ × 6 ТАЙМФРЕЙМОВ
───────────────────────────────────────────────────────────────
Колонка Что показывает
──────────── ──────────────────────────────────────────────
Символ Метка строки для настроенной пары
Ячейки по таймфрейму ▲ Бычий / ▼ Медвежий / — Нейтральный, цветовая кодировка
Опциональное значение силы ADX рядом с символом
"n/a" если для символа/таймфрейма недостаточно
истории для вычисления — он никогда не угадывает
Составной показатель BIAS = количество бычьих TF минус медвежьих TF
для этой строки, отображается, например, как "+3 ▲" или "-2 ▼"
Включаемый/выключаемый
Ячейка становится зелёной или красной только когда минимум 2 из 3 сигналов
согласны И ADX превышает заданный порог. Всё, что слабее,
по умолчанию остаётся нейтральным.
───────────────────────────────────────────────────────────────
ОСОБЕННОСТИ
───────────────────────────────────────────────────────────────
СИГНАЛЬНЫЙ ДВИГАТЕЛЬ
- Пересечение EMA Fast/Slow, настраиваемые периоды
- Подтверждение импульса линии MACD/сигнала/гистограммы
- Фильтр силы и направления Wilder ADX + DI+/DI-
- Читает только последний полностью закрытый бар — сигнал стабилен,
не перерисовывается в середине бара
- Автоматически исправляет инвертированный ввод EMA Fast/Slow и логирует это,
вместо того чтобы выдавать ошибочный результат
НАДЁЖНАЯ ПАНЕЛЬ
- Остаётся ровно там, где вы её разместили — без смещения, искажения или
необходимости перемещать при масштабировании или прокрутке графика
- Обновляется плавно на месте, тик за тиком, без мерцания
СТОЛБЕЦ СОСТАВНОГО BIAS
- Чистый голос быков минус медведей по каждому настроенному таймфрейму
- Мгновенно показывает, какие пары имеют согласованное направление
по всем таймфреймам, а какие находятся в конфликте
ОПОВЕЩЕНИЯ О ПЕРЕКЛЮЧЕНИИ
- Звуковое уведомление + сообщение на панели в момент изменения
составного смещения символа
- Нет ложных оповещений при первой загрузке — уведомляются только реальные переключения
- Сбой уведомления не влияет на работу самой панели
ВСЕГДА АКТУАЛЬНО
- Панель отражает текущие рыночные условия, так что вы
никогда не смотрите на устаревшие данные
ЛЁГКАЯ И БЕЗОПАСНАЯ
- Работает полностью внутри графика — без доступа к файлам, без внешних
подключений, ничего не выходит за пределы cTrader
───────────────────────────────────────────────────────────────
СТРАТЕГИЯ — КАК ИСПОЛЬЗОВАТЬ
───────────────────────────────────────────────────────────────
ШАГ 1 — ОПРЕДЕЛИТЬ СМЕЩЕНИЕ (старшие таймфреймы)
- Считайте ячейки D1 и W1 для строки символа
- Совпадающий цвет в обеих ячейках = подтверждённый тренд на старшем таймфрейме
ШАГ 2 — ПРОВЕРИТЬ СОГЛАСОВАННОСТЬ
- Считайте показатель BIAS для этой строки
- Высокий положительный/отрицательный показатель означает, что большинство таймфреймов согласны;
низкий или смешанный показатель означает конфликт — пропустите эту пару
ШАГ 3 — ПЕРЕЙТИ К ВАШЕМУ ТАЙМФРЕЙМУ ВХОДА
- Откройте график пары на вашем торговом таймфрейме
- Входите только в направлении, подтверждённом ARGUS на старшем таймфрейме
- Включите отображение значения силы ADX в ячейке, чтобы оценить, насколько сильным
в данный момент является это подтверждение, а не только по цвету
ШАГ 4 — ПОЗВОЛЬТЕ ОПОВЕЩЕНИЯМ О ПЕРЕКЛЮЧЕНИИ СЛЕДИТЬ ЗА СИТУАЦИЕЙ
- Включите оповещение при смене составного смещения и отойдите от экрана
- Получайте уведомления в момент изменения общего смещения пары,
вместо того чтобы вручную проверять каждый график
───────────────────────────────────────────────────────────────
ГРУППЫ ПАРАМЕТРОВ
───────────────────────────────────────────────────────────────
1. Символы и таймфреймы — CSV список, до 10 символов / 6 TF
2. EMA — периоды Fast / Slow
3. MACD — периоды Fast / Slow / Signal
4. ADX — период, порог (10–50)
5. Внешний вид — цвета быков/медведей/нейтральных/текста, ширина/высота ячейки,
смещение панели по X/Y, отображение составного столбца, отображение силы ADX
6. Оповещения — оповещение при смене составного смещения
7. Данные — количество загружаемых баров (100–2000)
───────────────────────────────────────────────────────────────
ДЛЯ КОГО ЭТО
───────────────────────────────────────────────────────────────
- Свинг/позиционные трейдеры, подтверждающие установки на разных таймфреймах
перед входом
- Мультипарные трейдеры, сканирующие несколько инструментов в поисках
самой сильной возможности прямо сейчас
- Все, кто хочет одну фиксированную, всегда точную панель вместо
шестидесяти ручных проверок графиков
Сводка
Key features include stable, non-repainting signals derived from fully closed bars, automatic correction of inverted EMA inputs, and a fixed panel position that updates smoothly without flicker. Users can configure symbols, timeframes, indicator parameters, appearance, and alert settings. Flip alerts notify users instantly when a symbol’s composite bias changes direction.
The dashboard supports swing and position traders who require multi-timeframe trend confirmation and multi-pair scanning without manual chart switching. It runs entirely within the chart environment, ensuring lightweight and secure operation with live market data updates.
Отзывы покупателей
5 | 100 % | |
4 | 0 % | |
3 | 0 % | |
2 | 0 % | |
1 | 0 % |