
الوصف
⚠️ لقد انتقلنا إلى 👉 PrimeQuant
🚫🚫🚫 لا تشترِ هذا المؤشر!
⚡ إصدار الجيل القادم متاح: تم إعادة تصميم وإعادة هيكلة وإعادة إصدار هذه الأداة الكلاسيكية من LudwigICT تحت علامتنا التجارية الجديدة للمطورين، PrimeQuant. يتميز الإصدار الجديد بواجهة مستخدم مبسطة وخصائص محدثة تتناسب مع ظروف السوق الحالية. احصل على النسخة المطورة بسعر مخفض هنا:
👉 مجموعة ICT SMC الكاملة - ADR AWR AMR OHLC Fibs EIS SR Alert
👉 مجموعة ICT SMC الكاملة - ADR AWR AMR OHLC Fibs EIS SR Alert
👉 مجموعة ICT SMC الكاملة - ADR AWR AMR OHLC Fibs EIS SR Alert
(يرجى الملاحظة: قائمة LudwigICT تظل نشطة للمستخدمين القدامى لكنها لن تتلقى تحديثات أو خصومات سعرية نشطة بعد الآن.)
🔥 مجموعة ICT المتقدمة + ADR + AWR برو
توقف عن التخمين وابدأ برؤية السوق بوضوح مؤسسي. مجموعة ICT المتقدمة برو من LudwigICT هي مجموعة أدوات رسم بياني احترافية متكاملة مصممة للمتداولين المتمرسين في حركة السعر. تم تصميمها بعناية لتكون نسخة مستقرة ومثالية بصريًا من مؤشر Pine Script الأسطوري، حيث تقوم هذه المجموعة بأتمتة المهمة المعقدة لرسم هياكل السوق الحرجة، مما يتيح لك التركيز على ما يهم حقًا: استراتيجيتك وتنفيذك.
هذه ليست مجرد مؤشر آخر؛ إنها إطار عمل كامل لرؤية السوق. من خلال دمج مفاهيم ICT الأساسية بسلاسة مثل السعر، الوقت، التقلب، والزخم، توفر هذه المجموعة رؤية لا مثيل لها على مستوى مؤسسي للأسواق المالية، مباشرة على مخطط cTrader الخاص بك.
لماذا تختار مجموعة LudwigICT؟
- كل شيء في حزمة واحدة: هذا المؤشر الواحد يحل محل عشرات الأدوات المنفصلة. تحصل على تحليل فيبوناتشي، توقعات النطاق، هيكل السوق متعدد المستويات، سياق الإطار الزمني الأعلى، وتلوين الزخم في حزمة خفيفة وفعالة.
- الاستقرار الثابت هو الملك: هل سبق واستخدمت مؤشرًا حيث تقفز المستويات وتُعاد رسمها أثناء التمرير؟ لقد حللنا هذه المشكلة. تضمن منطق التثبيت الذكي الخاص بنا أن مستويات فيبوناتشي الخاصة بك مرتبطة بمحاور تاريخية مهمة، مما يوفر إطارًا ثابتًا وموثوقًا يتكيف فقط عندما يتغير هيكل السوق فعليًا.
- الكمال البصري والوضوح: نعتقد أن أهم أصول المتداول هو تركيزه. تم تصميم هذه المجموعة لتعزيز الوضوح، وليس خلق الفوضى. العناصر نظيفة، غير متطفلة، وقابلة للتخصيص بالكامل. الإعدادات الافتراضية جاهزة للاستخدام الاحترافي مباشرة.
- مصممة بدقة للمتداولين الجادين: كل حساب، من نظام Elder Impulse إلى متوسط النطاق اليومي، تم اختباره بدقة ليطابق 1:1 منطق Pine Script الأصلي والموثوق. لا اختصارات، لا تقريب.
الميزات الرئيسية موضحة
تتكون المجموعة من عدة وحدات قوية ومستقلة يمكنك تبديلها وتخصيصها لتناسب أسلوب تداولك الدقيق.
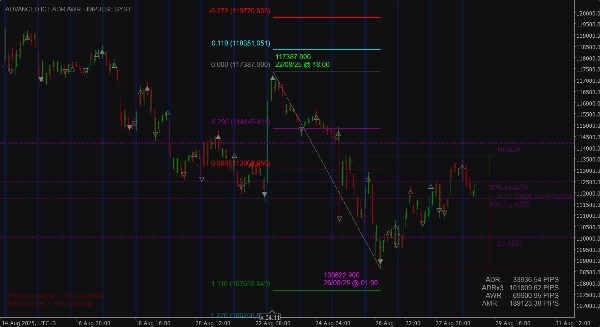
✔️ تصحيح فيبوناتشي مستقر ومثبت (قلب المجموعة)
أكثر أداة فيبوناتشي استقرارًا وذكاءً متاحة على cTrader.
- منطق التثبيت الذكي: يحدد تلقائيًا ويثبت على آخر ارتفاع وانخفاض هامين رئيسيين، مما يوفر نطاق سعر مستقر وموثوق لتحليلك.
- إعادة تعيين الاختراق الذكية: تبقى مستويات فيبوناتشي مثبتة حتى يقوم السعر بإغلاق حاسم يتجاوز النطاق المحدد (مسافة الاختراق قابلة للتخصيص بالكامل). هذا يمنع القفزات على التراجعات الطفيفة ويضمن التكيف فقط عندما يتغير هيكل السوق فعليًا.
- خط الاتجاه المتقطع المميز: الخط القطري المتقطع الأيقوني يربط نقاط التثبيت لنطاق فيبوناتشي الخاص بك، موفرًا تمثيلًا بصريًا واضحًا للاتجاه الذي تحلله.
- تراكب ZigZag اختياري: لتأكيد إضافي، يمكنك تفعيل تراكب ZigZag الكلاسيكي لرؤية مسار جميع المحاور التاريخية. يتم تعطيله افتراضيًا للحفاظ على نظافة المخطط.
✔️ نظام Elder Impulse (تلوين أشرطة الزخم)
قياس فوري لإجماع السوق الثلاثي: الاتجاه، الزخم، والقوة.
- الأشرطة الخضراء: تشير إلى إجماع صعودي (EMA 13 يرتفع ومخطط MACD يرتفع). السوق في اتجاه صعودي قوي.
- الأشرطة الحمراء: تشير إلى إجماع هبوطي (EMA 13 ينخفض ومخطط MACD ينخفض). السوق في اتجاه هبوطي قوي.
- الأشرطة الزرقاء: تشير إلى حالة حيادية أو خلاف بين الاتجاه والزخم. وقت للحذر.
- حدود الأشرطة: ميزة دقيقة ولكنها حاسمة. يتم رسم حدود ملونة حول كل شريط لإظهار اتجاهه الحقيقي (إغلاق صعودي أو هبوطي)، وهو أمر ضروري لتحليل الشموع بدقة عندما يتم تجاوز اللون الرئيسي.
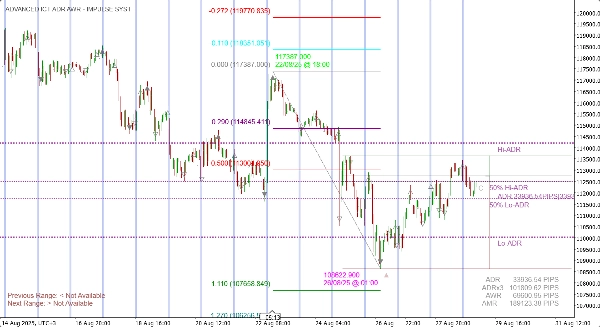
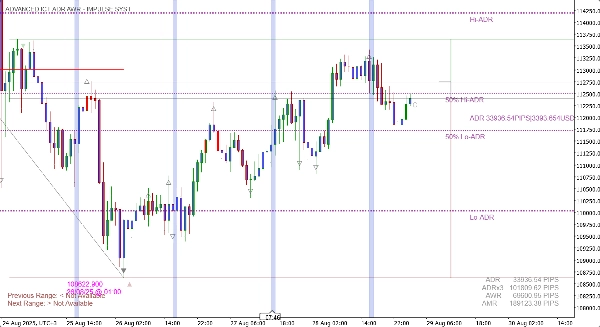
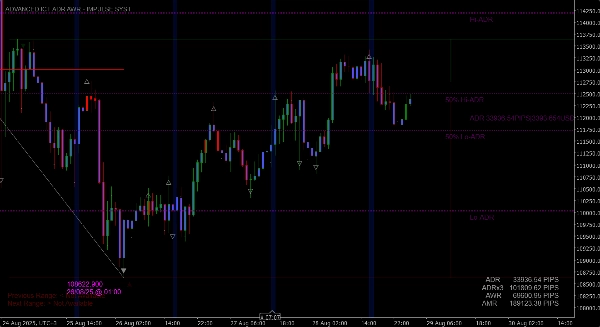
✔️ توقعات النطاق المتقدمة (ADR، AWR، AMR)
اعرف حدود أداتك وضع أهدافًا يومية وأسبوعية وشهرية واقعية.
- توقعات ديناميكية: تحسب تلقائيًا وترسم متوسط النطاق اليومي، متوسط النطاق الأسبوعي، ومتوسط النطاق الشهري.
- الارتفاعات والانخفاضات المتوقعة: شاهد مستويات الدعم والمقاومة المتوقعة بناءً على النطاقات المحسوبة.
- نقاط المنتصف 50%: حاسمة لتحديد التوازن ونقاط الانعكاس المحتملة داخل النطاق المتوقع.
- جدول بيانات على الشاشة: جدول نظيف وقابل للتخصيص يعرض جميع قيم النطاق الرئيسية بالنقاط و/أو العملة للرجوع السريع.
✔️ هيكل السوق متعدد المستويات (تقلبات ST، IT، LT)
توقف عن رسم نقاط التقلب يدويًا. المؤشر يقوم بذلك نيابة عنك.
- التعرف التلقائي: يرسم تقلبات قصيرة الأجل (ST)، متوسطة الأجل (IT)، وطويلة الأجل (LT) مباشرة على مخططك.
- رموز واضحة: يستخدم نظامًا بسيطًا وبديهيًا من النقاط والمثلثات لتمثيل تسلسل هيكل السوق.
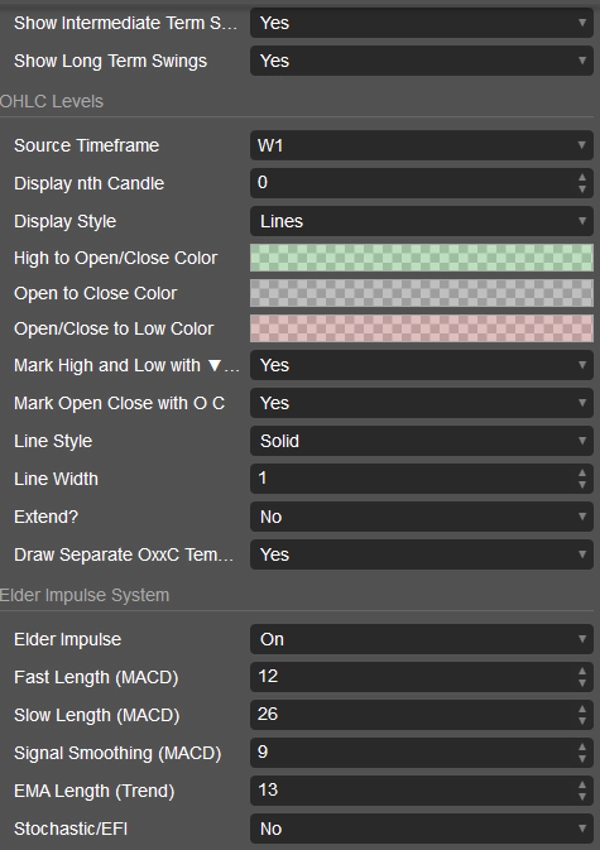
✔️ مستويات OHLC للإطار الزمني الأعلى
تداول مع سياق متعدد الأطر الزمنية دون مغادرة مخططك.
- مستويات السعر الرئيسية: تراكب الافتتاح، الأعلى، الأدنى، والإغلاق من أي إطار زمني أعلى (مثل الأسبوعي، اليومي) كخطوط نظيفة أو صناديق مظللة.
- تحليل الجلسة: شاهد فورًا مكان السعر الحالي بالنسبة لمستويات اليوم السابق أو الأسبوع السابق.
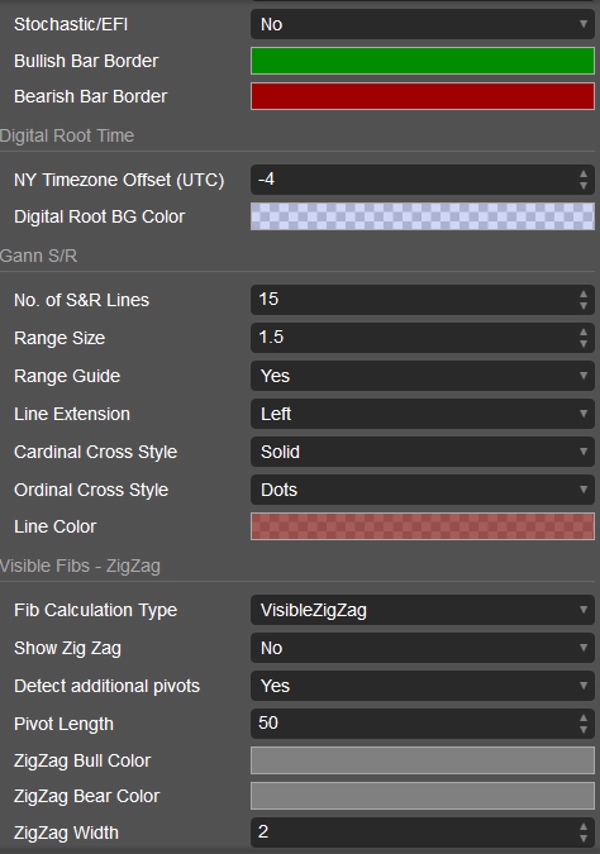
✔️ أدوات الدعم والمقاومة الديناميكية
- مستويات Gann S/R: مجموعة قوية من خطوط الدعم والمقاومة المستمدة رياضيًا والتي تتكيف مع تقلبات الأداة.
- الوقت الجذري الرقمي: يبرز نوافذ زمنية محددة مسبقًا بأشرطة رأسية كاملة الارتفاع تتغير ديناميكيًا أثناء التمرير والتكبير، مما يضمن ظهورها دائمًا.
كيفية استخدام مجموعة ICT المتقدمة برو
هذه المجموعة هي مجموعة أدوات متعددة الاستخدامات، وليست مؤشرًا بسيطًا لإشارات "شراء/بيع". إليك بعض الطرق لدمجها في تداولك:
- تداول التقاء عالي الاحتمالية:
-
- انتظر حتى يتراجع السعر إلى مستوى فيبوناتشي رئيسي (مثل 0.618 أو 0.786) ضمن اتجاه مستقر ومثبت.
- ابحث عن التقاء: هل يتوافق هذا المستوى مع مستوى OHLC للإطار الزمني الأعلى أو خط Gann S/R؟
- استخدم نظام Elder Impulse كمحفز للدخول. انتظر حتى يتغير تلوين الشريط لصالحك (مثلًا، من الأزرق/الأحمر إلى الأخضر للدخول الطويل) قبل تنفيذ الصفقة.
- حدد أهداف الربح عند مستوى امتداد فيبوناتشي التالي أو عند الارتفاع/الانخفاض المتوقع لـ ADR/AWR.
- تأكيد الاتجاه ودخول الزخم:
-
- حدد الاتجاه العام باستخدام نقاط تقلب هيكل السوق (مثل سلسلة من القمم والقيعان الأعلى).
- أثناء التراجع، انتظر حتى يتحول لون Elder Impulse إلى الأزرق (حيادي).
- ادخل الصفقة بمجرد أن يعود اللون إلى اتجاه اتجاهك (الأخضر للاتجاه الصعودي، الأحمر للاتجاه الهبوطي)
- تداول الانعكاس في النطاق والجلسة:
-
- راقب اقتراب السعر من حد رئيسي، مثل ارتفاع ADR المتوقع أو ارتفاع اليوم السابق.
- ابحث عن علامات الإرهاق، مثل فشل السعر في الإغلاق فوق المستوى وتحول لون Elder Impulse إلى الأزرق أو تغييره إلى اللون المعاكس.
- ادخل صفقة انعكاس، مستهدفًا مستوى 50% من ADR أو الجانب الآخر من النطاق.
القائمة الكاملة للمعلمات القابلة للتخصيص
(هذا القسم يمنح العملاء الثقة في مرونة المنتج)
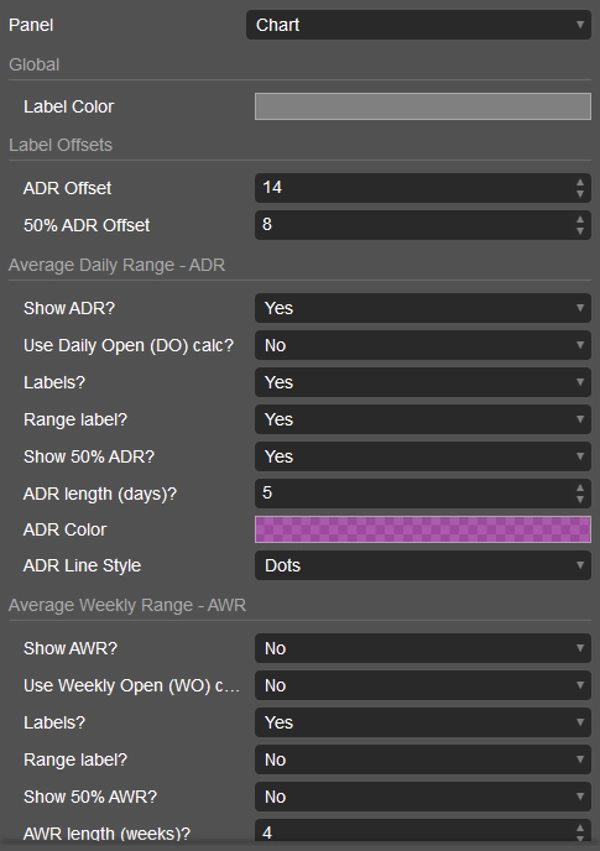
- الإعدادات العامة: ألوان التسميات، الإزاحات.
- متوسط النطاق اليومي (ADR): تشغيل/إيقاف، استخدام الافتتاح اليومي، عرض التسميات، عرض النطاق، عرض مستوى 50%، فترة النظر للخلف، اللون، نمط الخط.
- متوسط النطاق الأسبوعي (AWR): إعدادات قابلة للتخصيص بالكامل، مثل ADR.
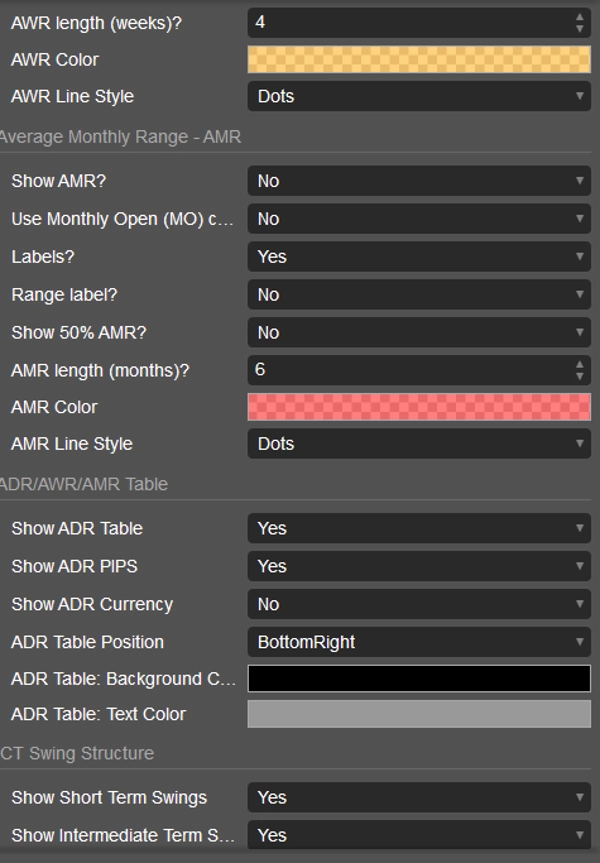
- متوسط النطاق الشهري (AMR): إعدادات قابلة للتخصيص بالكامل، مثل ADR.
- جدول البيانات: تشغيل/إيقاف، عرض النقاط، عرض العملة، موقع على الشاشة، الألوان.
- هيكل سوق ICT: تشغيل/إيقاف تقلبات ST، IT، وLT بشكل مستقل.
- مستويات OHLC: إطار زمني المصدر، فترة النظر للشمعة، نمط العرض (خطوط/صناديق)، كل الألوان، تعليم القمم/القيعان، تعليم الافتتاح/الإغلاق، تمديد الخطوط، عرض القالب.
- نظام Elder Impulse: تشغيل/إيقاف، كل معلمات MACD وEMA، وضع Stochastic/EFI، ألوان حدود الأشرطة الصعودية/الهبوطية.
- الوقت الجذري الرقمي: تعويض المنطقة الزمنية لنيويورك، لون الخلفية.
- Gann S/R: عدد الخطوط، حجم النطاق، تمديد الخط، أنماط الخط، اللون.
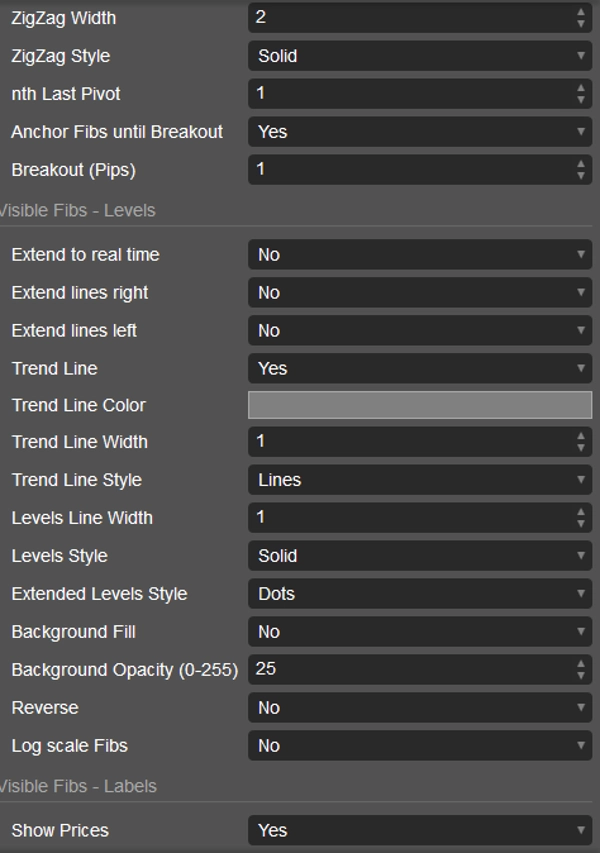
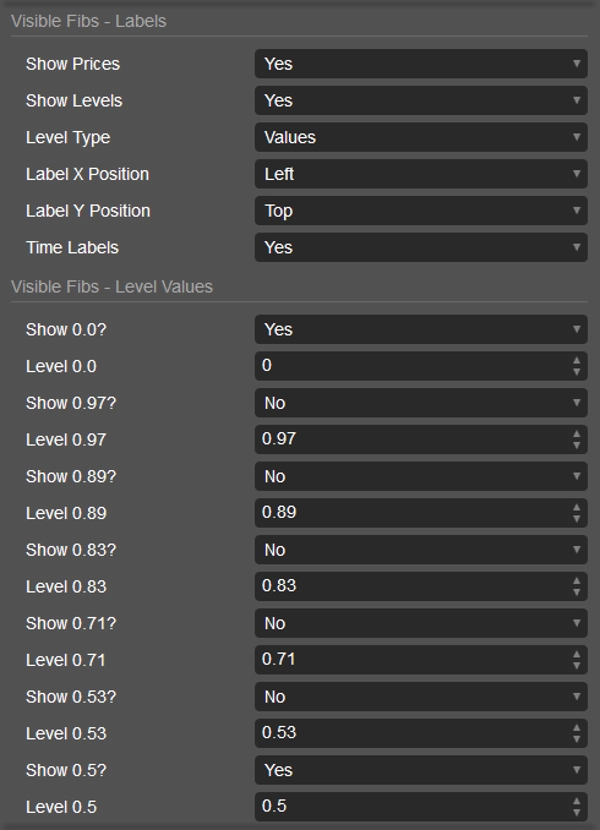
- فيبوناتشي المرئية: نوع الحساب (ZigZag/نطاق المخطط)، عرض ZigZag (مغلق افتراضيًا)، كل معلمات ZigZag، التثبيت المستقر وإعادة تعيين الاختراق، كل معلمات المستوى والخط، تعبئة الخلفية، عكس، مقياس لوغاريتمي، تحكم في التسميات، و أكثر من 25 مستوى فيبوناتشي فردي يمكن تشغيله، تخصيصه، وإعادة تلوينه.
ارتقِ بتداولك مع أفضل مجموعة أدوات لحركة السعر. توقف عن رسم الخطوط وابدأ برؤية الإعدادات. احصل على مجموعة ICT المتقدمة برو من LudwigICT اليوم! 🚀🚀🚀
إذا كان لديك أي أسئلة أو واجهت أي مشاكل، لا تتردد في الاتصال بي. أنا سعيد بمساعدتك!
إخلاء المسؤولية:
باستخدام خوارزمياتي، أنت تقر بأن التداول ينطوي على مخاطر متأصلة وأن الأداء السابق لا يضمن النتائج المستقبلية. من الضروري أن يكون لديك استراتيجية إدارة مخاطر قوية، وقبل كل شيء، أن تظل منضبطًا في الالتزام بمستويات وقف الخسارة. عدم إدارة المخاطر بشكل صحيح يمكن أن يؤدي إلى خسائر كبيرة. لست مسؤولًا عن أي نتائج مالية ناتجة عن استخدام هذه الخوارزميات. تداول بمسؤولية واتبع دائمًا ممارسات إدارة المخاطر المناسبة.
بارك الله فيك! 🙌
الملخص
تقييمات العملاء
5 | 50 % | |
4 | 50 % | |
3 | 0 % | |
2 | 0 % | |
1 | 0 % |


