
الوصف
لقد انتقلنا إلى 👉 PrimeQuant
🚫🚫🚫 لا تشترِ هذا المؤشر!
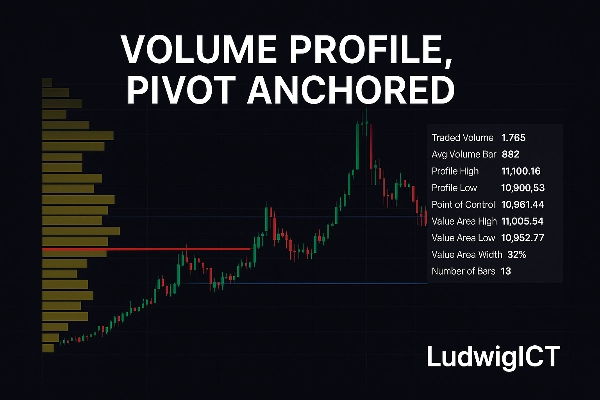
مؤشر ملف الحجم، المرتكز على المحور، يقدم نهجًا احترافيًا لتحليل هيكل السوق والحجم مباشرة في cTrader. مصمم للمتداولين الذين يقدرون الوضوح والدقة والرؤى القابلة للتنفيذ، يكشف كيف يتم توزيع نشاط التداول عبر السعر ضمن نطاقات تأرجح ذات معنى.
⚡عرض حصري – محدود لأول 10 مشترين!⚡
افتح الإمكانات الكاملة لاستراتيجيتك التداولية مع هذا المؤشر المخصص القوي، المصمم لمنحك ميزة دقيقة في السوق. تم تصميم هذه الأداة للمتداولين الجادين الذين يريدون إشارات واضحة وقابلة للتنفيذ واتخاذ قرارات محسنة عند التداول XAU/USD وأزواج الفوركس الأخرى.
🚀 لماذا تحصل عليه الآن:
متوفر بسعر إطلاق خاص – فقط لأول 10 متداولين
احصل على وصول إلى رؤى متقدمة لحركة السعر
مصمم لـ دقة وموثوقية عالية
مثالي لكل من التداول السريع وتأرجح التداول
بمجرد بيع 10 نسخ، هذا العرض لن يكون متاحًا بهذا السعر. احصل على نسختك اليوم وارتقِ بتداولك إلى المستوى التالي!
ما الذي يفعله؟
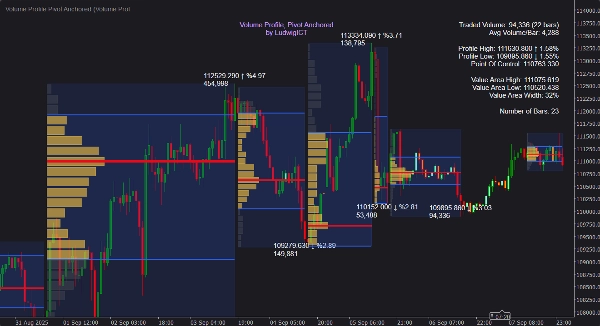
على عكس الملفات الثابتة أو القائمة على الجلسة، تقوم هذه الأداة تلقائيًا بربط ملفات الحجم بمحاور عالية ومنخفضة مهمة، مع رسم ديناميكي لعملية المزاد لكل تأرجح. هذا يجعل من الممكن رؤية أين التزم المشاركون في السوق فعليًا برأس المال — وليس فقط حيث تحرك السعر.
✨ العناصر الرئيسية تشمل:
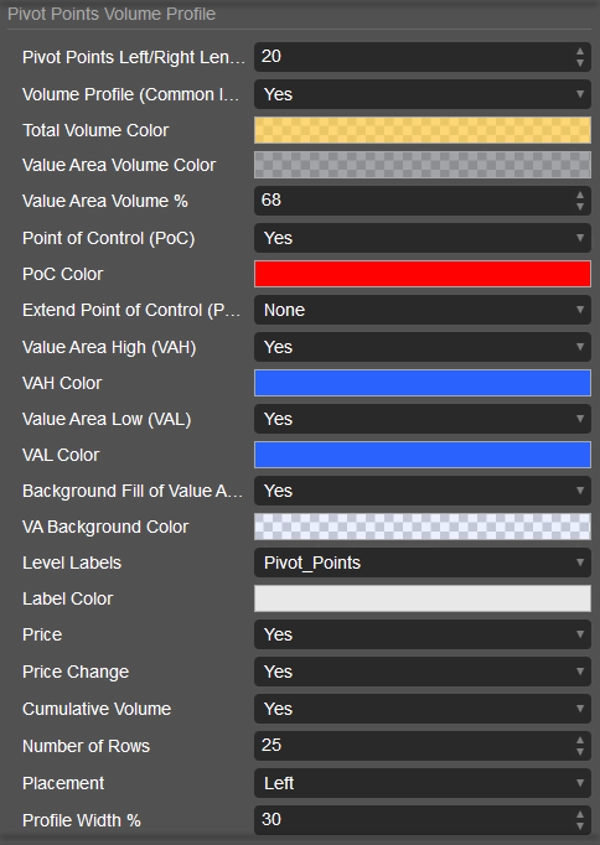
📍 الكشف التلقائي عن المحاور – تُبنى الملفات بين القمم والقيعان المتأرجحة، وتتحدث مع تكوين محاور جديدة.
📊 توزيع الحجم التفصيلي – تعرض الرسوم البيانية كيف يتم تخصيص الحجم عبر السعر، مع دقة وعرض يحدده المستخدم.
🎯 مستويات منطقة القيمة ونقطة التحكم – حساب فوري وتصوير لنقطة التحكم (POC)، أعلى منطقة القيمة (VAH)، وأدنى منطقة القيمة (VAL).
📈 الملف المتطور – ملف يتحدث مباشرة على الساق الحالية يوفر سياقًا مستقبليًا.
➡️ تمديد مناطق نقطة التحكم – إسقاط نقطة التحكم إلى الأمام حتى يتم لمسها أو عبورها بالسعر، مع إبراز مناطق رد الفعل المستقبلية.
📝 تسميات وأدوات معلومات – تسميات السعر، نسبة التغير، الحجم التراكمي، ولوحة إحصائية نظيفة عند المرور فوقها.
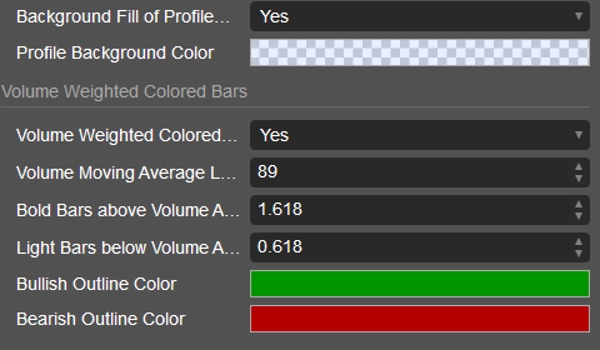
🎨 تلوين الأعمدة حسب الحجم – شموع مظللة حسب كثافة الحجم للتعرف السريع على الأنماط.
⚙️ تخصيص كامل – ضبط الألوان، الموضع، والعرض للاندماج بسلاسة مع نمط الرسم البياني الخاص بك.
كيفية الاستخدام
1️⃣ اربطه بأي رسم بياني – يعمل عبر جميع الأطر الزمنية والأدوات.
2️⃣ ضبط طول المحور – تحكم في حساسية القمم/القيعان المتأرجحة (الأقصر = المزيد من الملفات، الأطول = الهيكل الرئيسي فقط).
3️⃣ تفسير الملفات في السياق:
• 🎯 نقطة التحكم – مستوى السعر مع أكبر حجم تداول، غالبًا ما يكون مغناطيسًا.
• 📏 VAH / VAL – حدود منطقة القيمة، دعم/مقاومة قوية.
• 🌀 شكل المدرج التكراري – تحديد مناطق التوازن، مناطق الرفض، وتحولات التوزيع.
4️⃣ راقب الملف المتطور – تابع كيف يبني هيكل المزاد في الوقت الحقيقي.
5️⃣ استخدم التنبيهات – احصل على إشعارات عند تفاعل السعر مع نقطة التحكم، VAH، VAL، أو عند ظهور أعمدة ذات حجم مرتفع.
6️⃣ طبق كإطار عمل – حسّن الدخول عند مستويات قائمة على الحجم، توقع الانعكاسات، وحقق تأكيدات الاتجاهات من خلال هيكل الحجم.
لماذا يستخدمه المتداولون
يترجم هذا المؤشر الحجم الخام إلى هيكل ذي معنى. من خلال ربط الملفات بالمحاور، يتكيف مع ديناميكيات السوق الحية بدلاً من الاعتماد على تقسيمات الجلسة التعسفية. سواء كان التداول داخل اليوم، التأرجحي، أو الموضعي، يوفر توزيع الحجم المرتكز وضوحًا أعمق لاتخاذ القرار.
المعلمات الرئيسية بنظرة سريعة
⚙️ حساسية المحور – تحديد مدى قوة اكتشاف نقاط التأرجح.
📊 مستويات الملف والعرض – التحكم في دقة الملف والرؤية.
🎯 أوضاع تمديد نقطة التحكم – لا شيء، حتى الشمعة الأخيرة، حتى اللمس، أو حتى العبور.
📏 نسبة منطقة القيمة – قابلة للتعديل بالكامل (الافتراضي 68%).
🎨 تلوين الحجم – عتبات لتسليط الضوء على المشاركة القوية/الضعيفة.
ملف الحجم، المرتكز على المحور من LudwigICT ليس مجرد تصور عام — إنه عدسة هيكلية لكيفية إجراء المزادات في الأسواق فعليًا. للمتداولين الذين يطلبون أدوات احترافية، يوفر ميزة حاسمة في قراءة التفاعل بين السعر والحجم.
إذا كان لديك أي أسئلة أو واجهت أي مشاكل، لا تتردد في الاتصال بي. أنا سعيد بمساعدتك!
إخلاء المسؤولية:
باستخدام خوارزمياتي، فإنك تقر بأن التداول ينطوي على مخاطر متأصلة وأن الأداء السابق لا يضمن النتائج المستقبلية. من الضروري أن يكون لديك استراتيجية إدارة مخاطر قوية، وقبل كل شيء، أن تظل منضبطًا في الالتزام بمستويات وقف الخسارة. عدم إدارة المخاطر بشكل صحيح يمكن أن يؤدي إلى خسائر كبيرة. لست مسؤولًا عن أي نتائج مالية ناتجة عن استخدام هذه الخوارزميات. تداول بمسؤولية واتبع دائمًا ممارسات إدارة المخاطر المناسبة.
بارك الله فيكم! 🙌
الملخص
تقييمات العملاء
5 | 67 % | |
4 | 33 % | |
3 | 0 % | |
2 | 0 % | |
1 | 0 % |


