
الوصف
⚠️ لقد انتقلنا إلى 👉 PrimeQuant
🚫🚫🚫 لا تشترِ هذا المؤشر!
⚡ إصدار الجيل القادم متاح: تم إعادة تصميم وإعادة هيكلة وإعادة إصدار هذه الأداة الكلاسيكية LudwigICT تحت علامتنا التجارية الجديدة للمطورين، PrimeQuant. يتميز الإصدار الجديد بواجهة مستخدم مبسطة وخصائص محدثة تتناسب مع ظروف السوق الحالية. احصل على الإصدار المطور بسعر مخفض هنا:
👉 قناة السيولة الحقيقية
👉 قناة السيولة الحقيقية
👉 قناة السيولة الحقيقية
(يرجى الملاحظة: قائمة LudwigICT تظل نشطة للمستخدمين القدامى لكنها لن تتلقى تحديثات أو خصومات سعرية نشطة بعد الآن.)
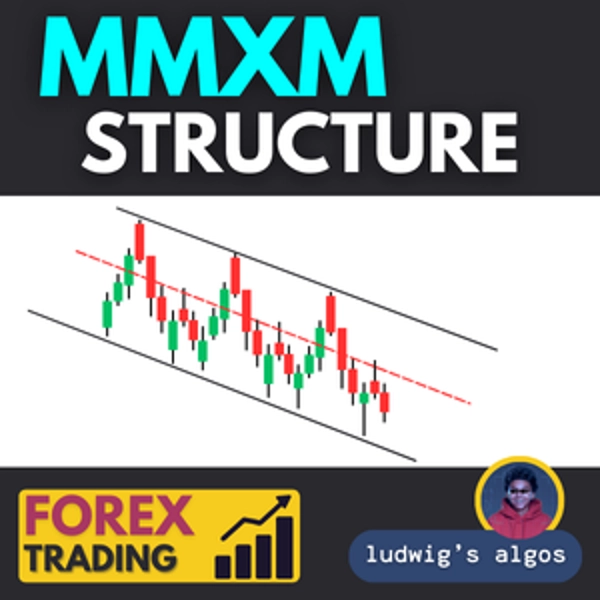
هذا هيكل MMXM هو في الأساس أداة لرسم هيكل السوق بناءً على التقلبات التي يمكن للمتداولين استخدامها لتحديد إعدادات البيع (أو إعدادات الشراء) بناءً على القمم والقيعان المتذبذبة وقمم السعر القصوى.
ال هيكل MMXM هو أداة متقدمة لتحليل حركة السعر مصممة لرسم هيكل السوق وتسليط الضوء على فرص التداول المحتملة بدقة.
يقوم هذا المؤشر بالكشف التلقائي ووضع علامات على القمم المتذبذبة و القيعان المتذبذبة خلال فترة نظر خلفية قابلة للتكوين، ويربطها بإطار ZigZag لجعل اتجاه السوق والتغيرات الهيكلية مرئية فوراً.
بالنسبة لـ إعدادات جانب البيع، يركز المؤشر على نهايات السوق العليا حيث وصل السعر إلى نقاط مقاومة أو استنفاد مهمة. يتم عرض هذه النقاط باللون الأحمر، وتعمل كمستويات مرجعية محتملة للدخول في مراكز بيع قصيرة. كما يقوم الأداة بإسقاط خطوط نهاية غلاف الجسم، التي تظهر أقصى وأدنى مدى لجسم الشمعة داخل التقلب، مما يسمح للمتداولين بتقييم ما إذا كان السعر مفرطاً قبل الانعكاس.
الميزات الرئيسية:
- الكشف التلقائي عن التقلبات: يحدد ويضع علامات على القمم والقيعان المحورية بدون تأخير أو إعادة رسم.
- تصوير هيكل ZigZag: يربط نقاط المحور لجعل تدفق الاتجاه والانقطاعات الهيكلية سهلة القراءة.
- علامات النهايات العليا (تركيز على البيع): يبرز القمم المهمة التي قد تعمل كمناطق عرض أو مقاومة.
- نهايات غلاف الجسم: يرسم خطوط مرجعية منقطة فوق وتحت التقلبات لقياس امتداد السعر.
- إسقاط خط التمديد: يمدد اختيارياً خط التقلب الأخير إلى الشمعة الحالية لتتبع السعر الحي.
- خيار التسمية: يعرض مستويات السعر الدقيقة عند نقاط التقلب لاستهداف دقيق.
- مظهر قابل للتخصيص: ألوان وأطوال وخيارات عرض قابلة للتعديل لتناسب أنماط التداول الفردية.
كيفية الاستخدام للبيع أو الشراء:
- انتظر ظهور علامة النهاية العليا (باللون الأحمر) عند قمة أو قاع مهم.
- أكد الانعكاس المحتمل بتقاطع إضافي (مثل شمعة رفض، تباعد، أو مستوى رئيسي).
- استخدم خط الاتجاه وخط النهاية كـ مرجع مقاومة.
- ادخل مراكز بيع قصيرة أو شراء طويلة مع وقف خسارة فوق آخر قمة أو قاع تقلب وحدد الأهداف بالقرب من القاع أو القمة التالية أو كسر الهيكل.
إذا كان لديك أي أسئلة أو واجهت أي مشاكل، لا تتردد في الاتصال بي. أنا سعيد بمساعدتك!
إخلاء المسؤولية:
باستخدام خوارزمياتي، أنت تقر بأن التداول ينطوي على مخاطر متأصلة وأن الأداء الماضي لا يضمن النتائج المستقبلية. من الضروري أن يكون لديك استراتيجية إدارة مخاطر قوية، وقبل كل شيء، أن تظل منضبطًا في الالتزام بمستويات وقف الخسارة. عدم إدارة المخاطر بشكل صحيح يمكن أن يؤدي إلى خسائر كبيرة. لست مسؤولاً عن أي نتائج مالية ناتجة عن استخدام هذه الخوارزميات. تداول بمسؤولية واتبع دائمًا ممارسات إدارة المخاطر المناسبة.
بارك الله فيك! 🙌
الملخص
تقييمات العملاء
5 | 33 % | |
4 | 67 % | |
3 | 0 % | |
2 | 0 % | |
1 | 0 % |


