
الوصف
⚠️ لقد انتقلنا إلى 👉 PrimeQuant
🚫🚫🚫 لا تشترِ هذا المؤشر!
🎯 نظرة عامة
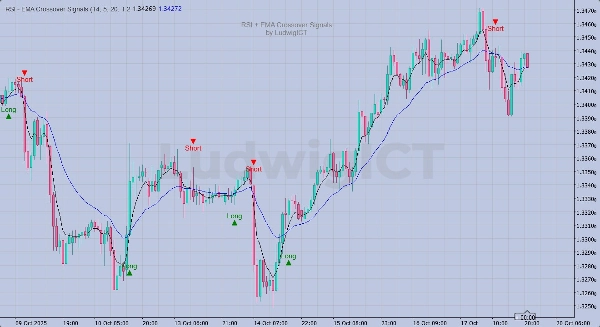
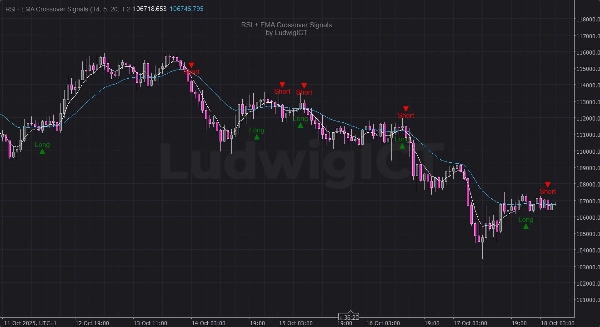
مؤشر إشارات تقاطع RSI + EMA من LudwigICT يجمع بين الزخم و تأكيد الاتجاه لتوليد إشارات تداول طويلة/قصيرة عالية الثقة — مباشرة على الرسم البياني الخاص بك.
⚙️ كيف يعمل:
- مرحلة إشارة RSI:
-
- يتم تسليح الإشارة عندما يعبر RSI خط إشارة SMA الخاص به.
- مرحلة تأكيد EMA:
-
- يتم تفعيل الإشارة فقط عندما يتقاطع EMA السريع والبطيء في نفس الاتجاه.
- إلغاء الإشارة:
-
- أي تقاطع معاكس (RSI أو EMA) يلغي إشارة غير مفعلة.
✨ الميزات الرئيسية:
- 🔁 منطق تأكيد مزدوج (RSI + EMA)
- 📈 أيقونات واضحة طويلة و قصيرة مرسومة مباشرة على الرسم البياني
- ⚡ إزاحات بصرية ديناميكية تعتمد على ATR (تتكيف تلقائيًا مع التقلب)
- 💧 تراكب نظيف مع علامة مائية دائمة للعلامة التجارية
- 🧠 منطق ذكي لـ “التسليح” و “الإلغاء” لتقليل التنبيهات الخاطئة
- 🧮 معلمات RSI و EMA والإزاحة قابلة للتعديل بالكامل
🔧 المدخلات:
- فترة RSI (الافتراضي: 14)
- EMA السريع (الافتراضي: 5)
- EMA البطيء (الافتراضي: 20)
- إزاحة الإشارة (مضاعف ATR، الافتراضي: 1.2)
📊 مثالي لـ:
- متداولي الزخم
- أنظمة تأكيد الاتجاه
- استراتيجيات التداول اليدوي أو شبه الآلي
📅 تحديثات الإصدار:
- ✅ إضافة إزاحة ديناميكية تعتمد على ATR لعرض أوضح
- ✅ تحسين منطق دقة الإشارة
- ✅ إضافة علامة مائية غير قابلة للإزالة للأصالة
© 2025 LudwigICT — جميع الحقوق محفوظة.
إذا كان لديك أي أسئلة أو واجهت أي مشاكل، لا تتردد في الاتصال بي. أنا سعيد بمساعدتك!
إخلاء المسؤولية:
باستخدام خوارزمياتي، أنت تقر بأن التداول ينطوي على مخاطر متأصلة وأن الأداء السابق لا يضمن النتائج المستقبلية. من الضروري أن يكون لديك استراتيجية إدارة مخاطر قوية، وقبل كل شيء، أن تظل منضبطًا في الالتزام بمستويات وقف الخسارة. عدم إدارة المخاطر بشكل صحيح يمكن أن يؤدي إلى خسائر كبيرة. أنا لست مسؤولاً عن أي نتائج مالية ناتجة عن استخدام هذه الخوارزميات. تداول بمسؤولية واتبع دائمًا ممارسات إدارة المخاطر المناسبة.
بارك الله فيك! 🙌
الملخص
تقييمات العملاء
5 | 0 % | |
4 | 100 % | |
3 | 0 % | |
2 | 0 % | |
1 | 0 % |


