
الوصف
⚠️ انتقلنا إلى 👉 PrimeQuant
🚫🚫🚫 لا تشترِ هذا المؤشر!
⚡ إصدار الجيل القادم متاح: تم إعادة تصميم وإعادة هيكلة وإعادة إصدار هذه الأداة الكلاسيكية من LudwigICT تحت علامتنا التجارية الجديدة للمطورين، PrimeQuant. يتميز الإصدار الجديد بواجهة مستخدم مبسطة وخصائص محدثة لظروف السوق الحالية. احصل على الإصدار المطور بسعر مخفض هنا:
👉 مرشح الاتجاه الغاوسي ALMA
👉 مرشح الاتجاه الغاوسي ALMA
👉 مرشح الاتجاه الغاوسي ALMA
(يرجى الملاحظة: يظل إدراج LudwigICT نشطًا للمستخدمين القدامى ولكنه لن يتلقى تحديثات أو خصومات سعرية نشطة بعد الآن.)
المتوسط المتحرك الغاوسي المملس ALMA (ASGMA) – من LudwigICT
مؤشر دقيق لمتابعة الاتجاه يجمع بين تنعيم ALMA مع متوسط متحرك غاوسي تكيفي لقطع الضوضاء وكشف الانحياز الحقيقي للسوق.
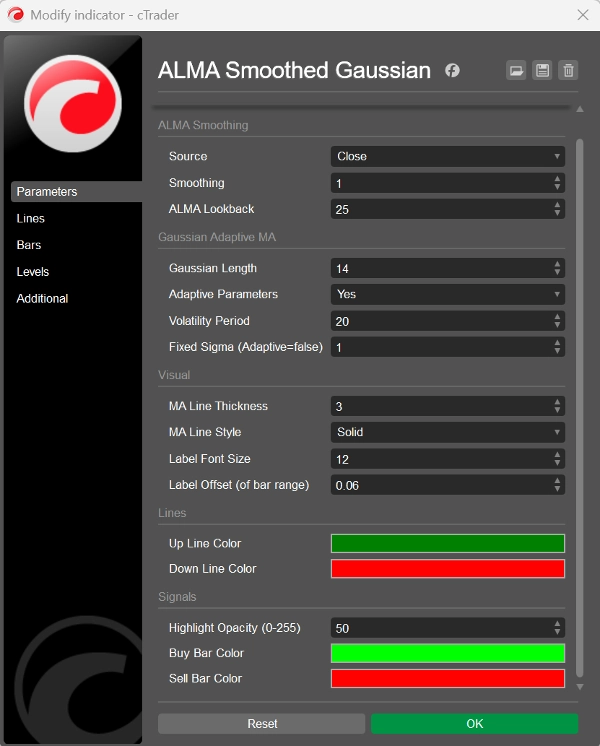
🔹 كيف يعمل:
- يأخذ مصدر السعر الذي تختاره (الإغلاق، الافتتاح، الأعلى، الأدنى، HL2، HLC3، OHLC4).
- يقيس التغير النسبي وينعمه باستخدام ALMA (المتوسط المتحرك أرنو ليجوكس).
- يطبق مرشح غاوسي (تكيفي مع التقلب، أو ثابت) للحصول على خط اتجاه مصقول.
- يؤكد الاتجاه باستخدام EMA للإغلاق (7) لمحاذاة سريعة الاستجابة.
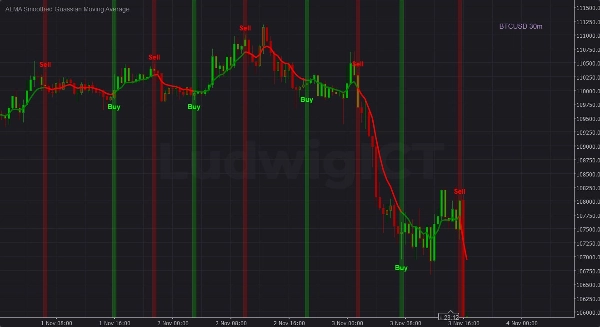
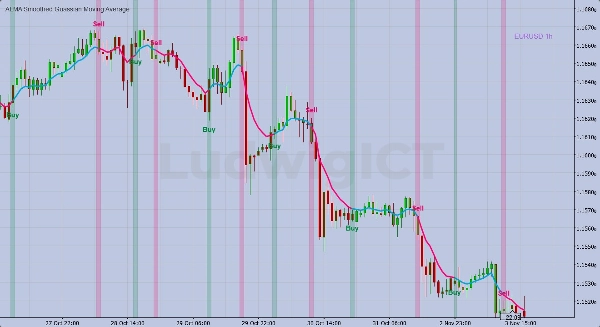
🔹 ما تراه على الرسم البياني:
- خط الاتجاه: أخضر = اتجاه صاعد، أحمر = اتجاه هابط.
- إعادة تلوين الشموع: ألوان جسم وفتيل متوافقة مع الاتجاه للتعرف الفوري على الانحياز.
- إشارات شراء/بيع: أشرطة مميزة + تسميات عريضة عندما يعبر ALMA فوق/تحت المتوسط المتحرك الغاوسي.
- تسليط الضوء بارتفاع كامل: تبقى مرئية عند التكبير/التصغير (لا تفوت الإشارات).
🔹 ما يقدمه للمتداولين:
✅ خريطة اتجاه نظيفة وخالية من التأخير
✅ إشارات شراء/بيع سريعة عند تغير الزخم
✅ تقليل ازدحام الرسم البياني، وزيادة الثقة في التنفيذ
👉 باختصار: إنه مؤشر اتجاه دقيق يفلتر الضوضاء، ويتكيف مع التقلبات، ويعطي إشارات شراء/بيع واضحة بصريًا.
إذا كان لديك أي أسئلة أو واجهت أي مشاكل، لا تتردد في الاتصال بي. أنا سعيد بمساعدتك!
إخلاء المسؤولية:
باستخدام خوارزمياتي، فإنك تقر بأن التداول ينطوي على مخاطر متأصلة وأن الأداء السابق لا يضمن النتائج المستقبلية. من الضروري أن يكون لديك استراتيجية إدارة مخاطر قوية، وقبل كل شيء، أن تظل منضبطًا في الالتزام بمستويات وقف الخسارة. عدم إدارة المخاطر بشكل صحيح قد يؤدي إلى خسائر كبيرة. أنا غير مسؤول عن أي نتائج مالية ناتجة عن استخدام هذه الخوارزميات. تداول بمسؤولية واتبع دائمًا ممارسات إدارة المخاطر المناسبة.
بارك الله فيكم! 🙌
الملخص
تقييمات العملاء
5 | 33 % | |
4 | 67 % | |
3 | 0 % | |
2 | 0 % | |
1 | 0 % |


