
ICT Concepts from TradingView
インジケーター
4 購入済
バージョン 1.0、Nov 2025
Windows、Mac
4.5
レビュー: 2
説明
⚠️ 移動しました 👉 PrimeQuant
🚫🚫🚫 このインジケーターは購入しないでください!
LudwigICTによるICT CONCEPTS(TradingViewの人気ICT ConceptsのcTrader版)
プロの視点で市場を可視化するために構築されたスマートマネーツールの完全なスイート、ICT Conceptsで機関投資家の精度を体験してください。
🔹 特徴
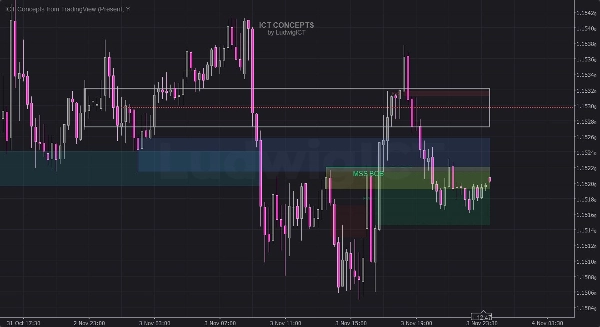
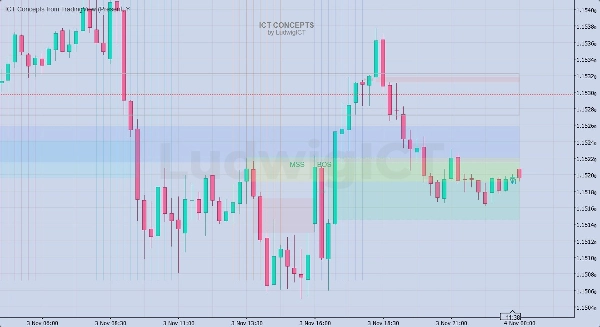
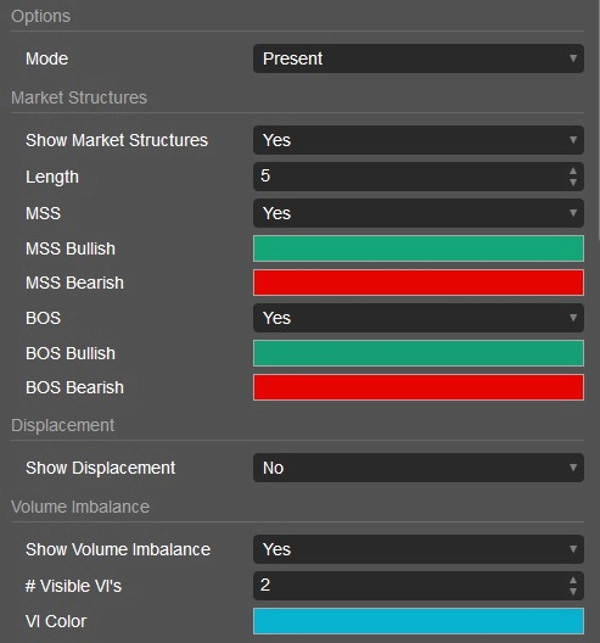
- 📈 マーケット構造検出 — 価格変動にリアルタイムで適応する自動BOS(ブレイクオブストラクチャー)およびMSS(マーケットストラクチャーシフト)ハイライト。
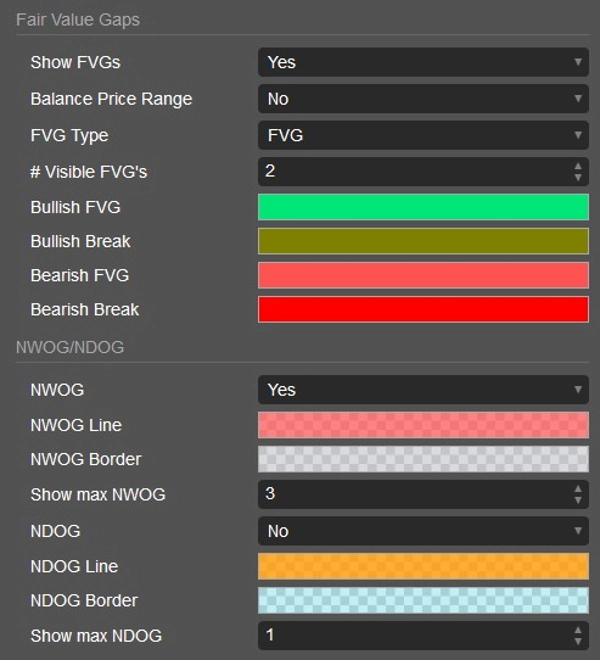
- 🟩 フェアバリューギャップ(FVG)&バランスプライスレンジ(BPR) — プロのICTモデルのようにプレミアムおよびディスカウントゾーンを瞬時に識別。
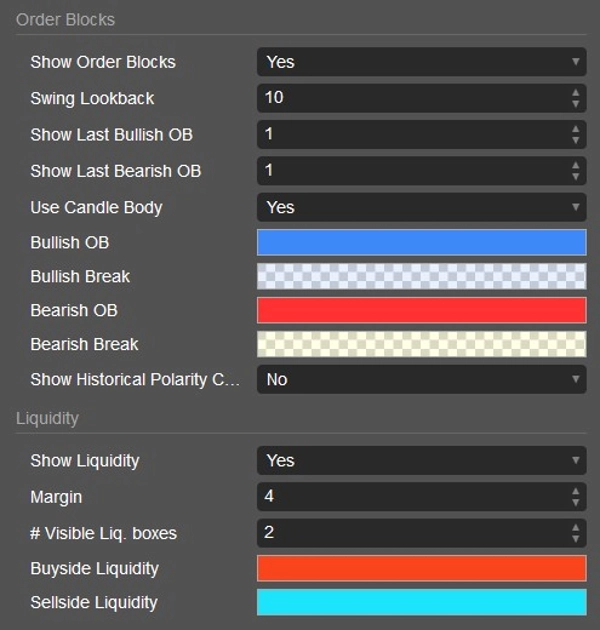
- 💧 流動性ゾーン — 価格が反応または探索する可能性のある買い側および売り側の流動性プールを自動的にマーク。
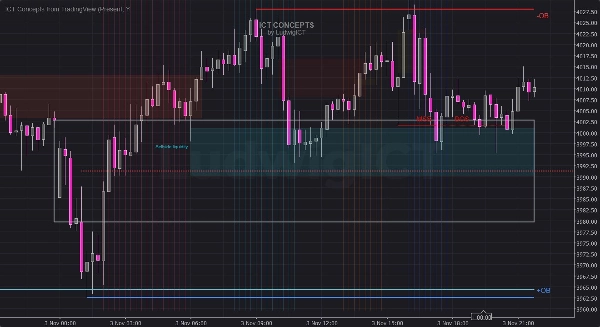
- 🧱 オーダーブロック(OB) — 強気および弱気のオーダーブロックを識別し、それらが保持されるか破られるかを追跡。
- ⚡ ボリュームアンバランス&ディスプレイスメントキャンドル — 買い手と売り手の間の機関の強さと非効率性を示す。
- 🌅 NWOG / NDOGギャップ — 欠落している価格領域を強調するための週次および日次のオープニングギャップを表示。
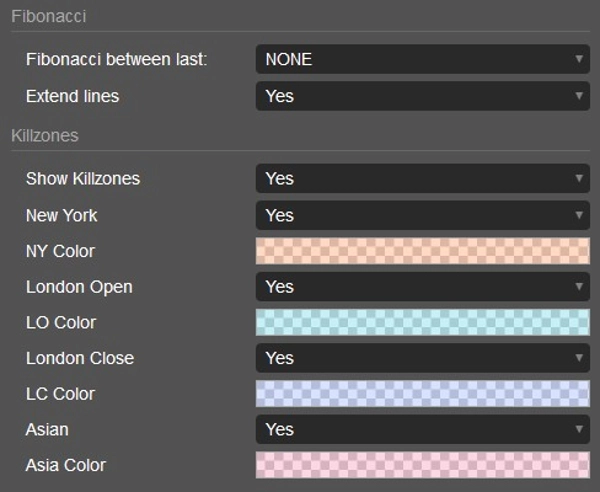
- 🕓 キルゾーンオーバーレイ — 時間ベースのコンフルエンスのためにロンドン、ニューヨーク、アジアのセッションを表示。
- 🔢 統合フィボナッチターゲット — 選択した構造に合わせて自動的にリトレースメントとプロジェクションをプロット。
🧭 使い方
- 任意のチャートにインジケーターを取り付け、デフォルト設定のままで開始してください — シンボルとタイムフレームに自動的に適応します。
- 複数のコンセプトを組み合わせます:例えば、BOS + FVG + OBの整合性を探して高確率のセットアップを狙います。
- 流動性プール、ディスプレイスメントキャンドル、週次ギャップ周辺の価格動向を研究するために使用します。
- 日中取引者は、最も活発なセッションに集中するためにキルゾーンを有効にします。
- 「Visible FVGs」や「Max NWOG」などの表示制限を調整して、お好みのチャートの明瞭さに合わせてください。
このツールはForex、指数、商品、暗号通貨、株式でシームレスに機能し、分析と実行の両方に最適です。
⚙️ ブローカーやTradingView間で結果がわずかに異なる理由
cTraderはブローカーのサーバー時間、シンボルフィード、データ集約を使用しますが、TradingViewはしばしば複合または合成フィードを使用します。
キャンドルの終値、週末のデータ処理、または小数点価格のわずかな違いが、構造(BOSやOBなど)の位置をわずかにずらすことがあります。
これらは取引プラットフォーム間で通常のことであり、コンセプトの基本的な論理や信頼性には影響しません。
⚠️ 免責事項
このインジケーターは専門的な分析ツールであり、金融アドバイスではありません。
取引を行う前に必ずご自身で分析を行い、リスクを適切に管理してください
概要
インジケーターのプロフィール
カスタマーレビュー
4.5
レビュー: 2
5 | 50 % | |
4 | 50 % | |
3 | 0 % | |
2 | 0 % | |
1 | 0 % |
ディスカッション
よくあるご質問
Fibonacci
Forex
Signal
Breakout
Fair Value Gap
SMC
VWAP
cTrader Storeで入手可能な取引ボット、インジケーター、プラグインなどの商品は、第三者の開発者が提供するものであり、情報と技術の取得のみを目的としてご利用いただけます。cTrader Storeはブローカーではなく、投資助言や個人的な推奨を行うことも、将来のパフォーマンスを保証することもありません。
この作成者の他の商品


これも好きかも


価格
17.89M
取引数量
60.07K
獲得pips
125
販売
4.91K
無料インストール