
Descripción
Nos mudamos a 👉 PrimeQuant
🚫🚫🚫 ¡No compres este indicador!
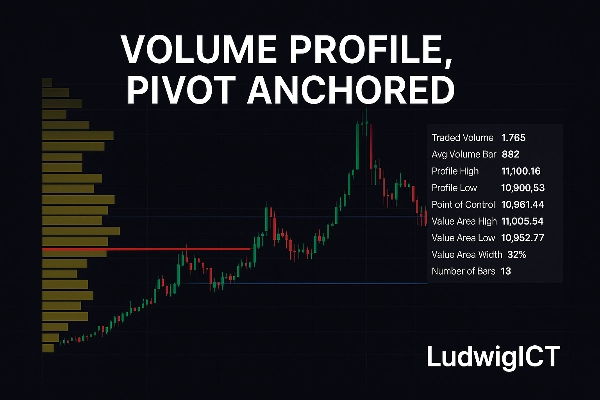
El indicador Volume Profile, Pivot Anchored aporta un enfoque profesional al análisis de la estructura del mercado y el volumen directamente en cTrader. Diseñado para traders que valoran la claridad, precisión y conocimientos prácticos, revela cómo se distribuye la actividad comercial a lo largo del precio dentro de rangos de oscilación significativos.
⚡Oferta exclusiva – ¡Limitada a los primeros 10 compradores!⚡
Desbloquea todo el potencial de tu estrategia de trading con este poderoso indicador personalizado, diseñado para darte una ventaja precisa en el mercado. Esta herramienta ha sido creada para traders serios que desean señales claras y accionables y una mejor toma de decisiones al operar XAU/USD y otros pares de Forex.
🚀 Por qué obtenerlo ahora:
Disponible a un precio especial de lanzamiento – solo para los primeros 10 traders
Accede a conocimientos avanzados de acción del precio
Diseñado para alta precisión y fiabilidad
Perfecto tanto para scalping como para swing trading
Una vez que se vendan 10 copias, esta oferta ya no estará disponible a este precio. ¡Asegura tu copia hoy y lleva tu trading al siguiente nivel!
¿Qué hace?
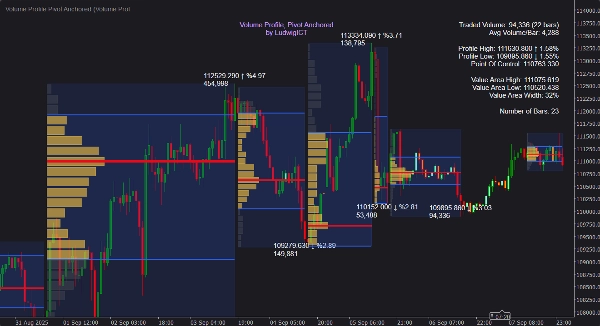
A diferencia de perfiles fijos o basados en sesiones, esta herramienta ancla automáticamente los perfiles de volumen a pivotes significativos altos y bajos, mapeando dinámicamente el proceso de subasta de cada oscilación. Esto permite ver dónde los participantes del mercado realmente comprometieron capital — no solo dónde se movió el precio.
✨ Elementos clave incluyen:
📍 Detección automática de pivotes – Los perfiles se construyen entre altos y bajos de oscilación, actualizándose a medida que se forman nuevos pivotes.
📊 Distribución detallada del volumen – Histogramas muestran cómo se asigna el volumen a lo largo del precio, con resolución y ancho definidos por el usuario.
🎯 Niveles de Área de Valor y POC – Cálculo y visualización instantánea del Punto de Control (POC), Área de Valor Alta (VAH) y Área de Valor Baja (VAL).
📈 Perfil en desarrollo – Un perfil que se actualiza en vivo en la pierna actual proporciona contexto prospectivo.
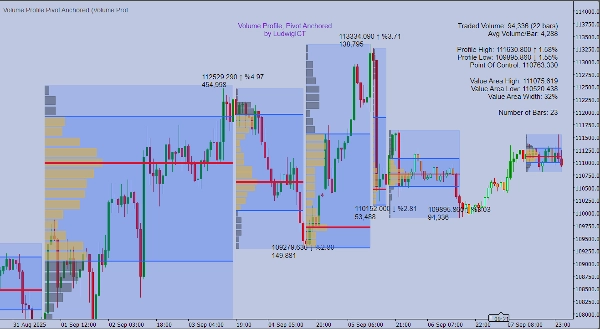
➡️ Extensión de zonas POC – Proyecta el POC hacia adelante hasta que sea tocado o cruzado por el precio, destacando zonas de reacción futuras.
📝 Etiquetas informativas y tooltips – Etiquetas de precio, cambio %, volumen acumulado y un panel estadístico limpio al pasar el cursor.
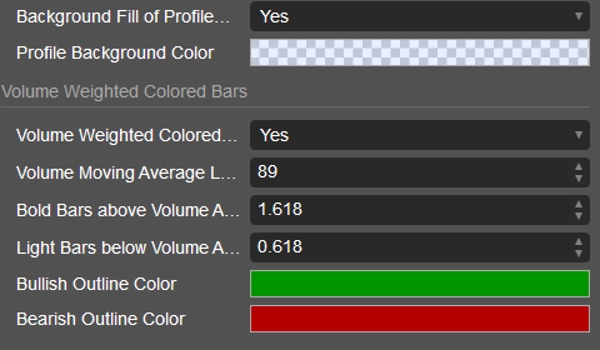
🎨 Coloreado de barras ponderado por volumen – Velas sombreadas según la intensidad del volumen para un reconocimiento rápido de patrones.
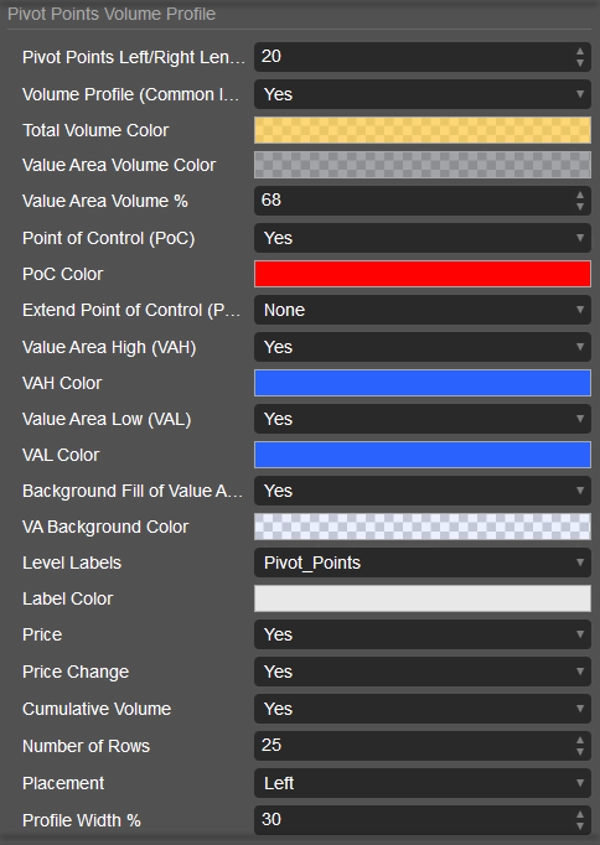
⚙️ Personalización completa – Ajusta colores, ubicación y visualización para integrarse perfectamente con el estilo de tu gráfico.
Cómo usar
1️⃣ Adjunta a cualquier gráfico – funciona en todos los marcos temporales e instrumentos.
2️⃣ Ajusta la longitud del pivote – controla la sensibilidad a los altos/bajos de oscilación (más corto = más perfiles, más largo = solo estructura mayor).
3️⃣ Interpreta los perfiles en contexto:
• 🎯 POC – nivel de precio con mayor volumen negociado, a menudo un imán.
• 📏 VAH / VAL – límites del área de valor, soporte/resistencia potente.
• 🌀 Forma del histograma – identifica áreas de equilibrio, zonas de rechazo y cambios en la distribución.
4️⃣ Observa el perfil en desarrollo – sigue cómo se construye la estructura de subasta en tiempo real.
5️⃣ Usa alertas – recibe notificaciones cuando el precio interactúa con POC, VAH, VAL, o cuando aparecen barras de alto volumen.
6️⃣ Aplica como marco – refina entradas en niveles basados en volumen, anticipa reversiones y confirma tendencias mediante la estructura de volumen.
Por qué los traders lo usan
Este indicador traduce el volumen bruto en una estructura significativa. Al anclar perfiles a pivotes, se adapta a la dinámica del mercado en vivo en lugar de depender de divisiones arbitrarias de sesión. Ya sea trading intradía, swing o posicional, la distribución de volumen anclada proporciona mayor claridad para la toma de decisiones.
Parámetros clave de un vistazo
⚙️ Sensibilidad del pivote – define qué tan agresivamente se detectan los puntos de oscilación.
📊 Niveles y ancho del perfil – controla la resolución y visibilidad del perfil.
🎯 Modos de extensión POC – Ninguno, hasta la última barra, hasta el toque o hasta el cruce.
📏 % Área de Valor – totalmente ajustable (por defecto 68%).
🎨 Coloreado por volumen – umbrales para resaltar participación fuerte/débil.
Volume Profile, Pivot Anchored de LudwigICT no es una visualización genérica — es una lente estructural para entender cómo los mercados realmente subastan. Para traders que exigen herramientas profesionales, proporciona una ventaja decisiva para leer la interacción entre precio y volumen.
Si tienes alguna pregunta o encuentras algún problema, no dudes en contactarme. ¡Estoy feliz de ayudarte!
Descargo de responsabilidad:
Al usar mis algoritmos, reconoces que el trading implica riesgos inherentes y que el rendimiento pasado no garantiza resultados futuros. Es esencial que tengas una estrategia sólida de gestión de riesgos y, sobre todo, que mantengas la disciplina para respetar los niveles de stop-loss. No gestionar el riesgo adecuadamente puede llevar a pérdidas significativas. No soy responsable de ningún resultado financiero derivado del uso de estos algoritmos. Opera con responsabilidad y siempre sigue prácticas adecuadas de gestión de riesgos.
¡Bendiciones! 🙌
Resumen
Valoraciones de clientes
5 | 67 % | |
4 | 33 % | |
3 | 0 % | |
2 | 0 % | |
1 | 0 % |


