
Descrição
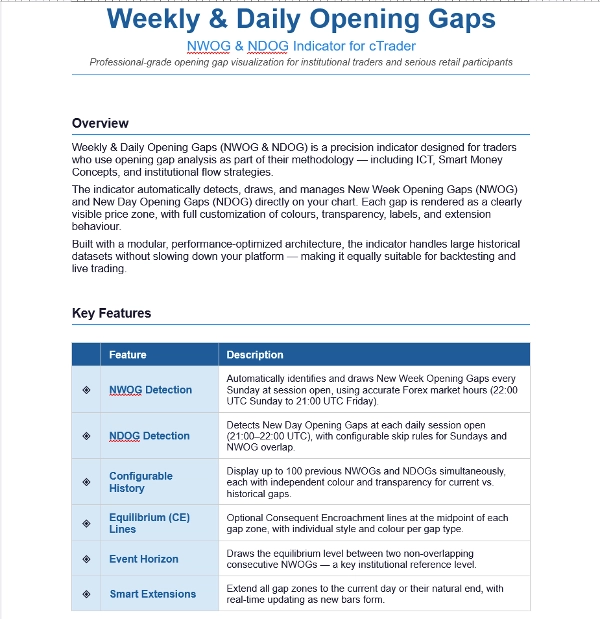
Gaps de Abertura Semanais & Diários — Indicador NWOG & NDOG
Visualização de gaps de abertura de nível profissional para traders institucionais e participantes sérios do varejo
VISÃO GERAL
Gaps de Abertura Semanais & Diários (NWOG & NDOG) é um indicador de precisão projetado para traders que utilizam a análise de gaps de abertura como parte de sua metodologia — incluindo ICT, Conceitos de Smart Money e estratégias de fluxo institucional.
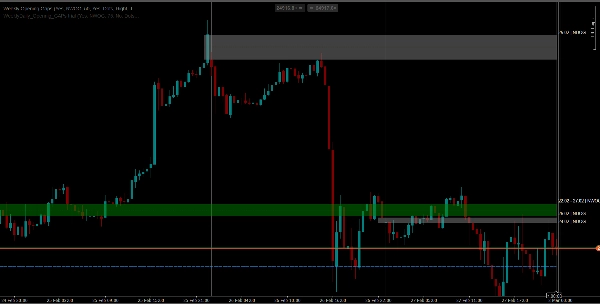
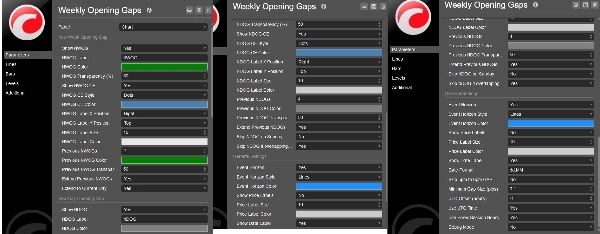
O indicador detecta, desenha e gerencia automaticamente os Gaps de Abertura da Nova Semana (NWOG) e os Gaps de Abertura do Novo Dia (NDOG) diretamente no seu gráfico. Cada gap é representado como uma zona de preço claramente visível, com personalização completa de cores, transparência, etiquetas e comportamento de extensão.
Construído com uma arquitetura modular e otimizada para desempenho, o indicador lida com grandes conjuntos de dados históricos sem desacelerar sua plataforma — tornando-o igualmente adequado para backtesting e trading ao vivo.
PRINCIPAIS RECURSOS
◈ Detecção NWOG
◈ Detecção NDOG com regras configuráveis de pular para domingos e sobreposição NWOG.
◈ Histórico Configurável — Exibe até 100 NWOGs anteriores
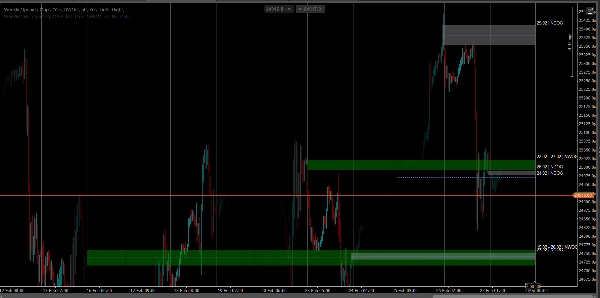
◈ Linhas de Equilíbrio (CE)
◈ Horizonte de Evento — Desenha o nível de equilíbrio entre dois NWOGs consecutivos não sobrepostos
◈ Extensões Inteligentes — Estende todas as zonas de gap até o dia atual ou seu fim natural, com atualização em tempo real conforme novas barras se formam.
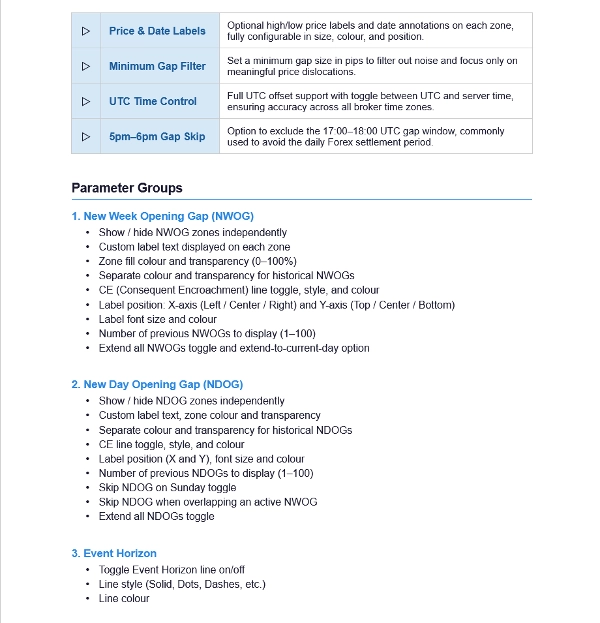
◈ Etiquetas de Preço & Data
◈ Filtro de Gap Mínimo
◈ Controle de Hora UTC
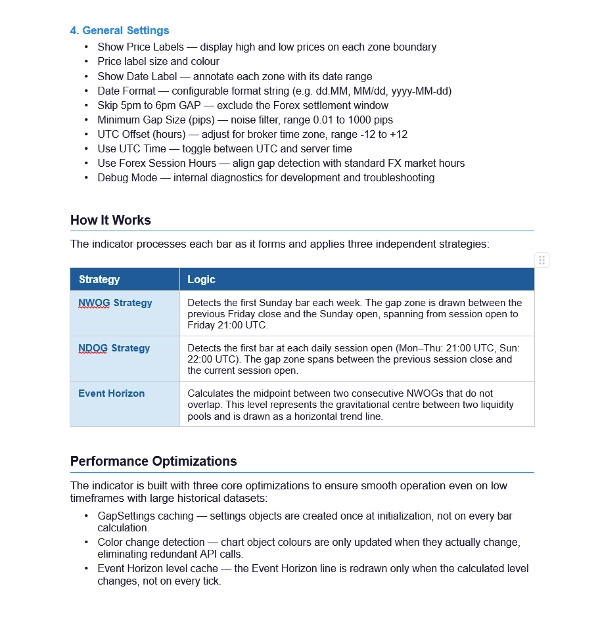
COMO FUNCIONA
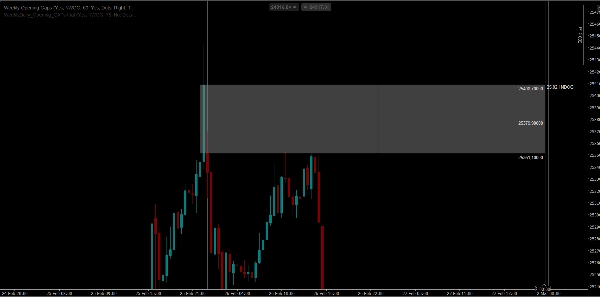
Estratégia NWOG — Detecta a primeira barra de domingo de cada semana. A zona de gap é desenhada entre o fechamento da sexta-feira anterior e a abertura do domingo, abrangendo desde a abertura da sessão até sexta-feira às 21:00 UTC.
Estratégia NDOG — Detecta a primeira barra em cada abertura de sessão diária (Seg–Qui: 21:00 UTC, Dom: 22:00 UTC). A zona de gap abrange entre o fechamento da sessão anterior e a abertura da sessão atual.
Horizonte de Evento — Calcula o ponto médio entre dois NWOGs consecutivos que não se sobrepõem. Este nível representa o centro gravitacional entre dois pools de liquidez e é desenhado como uma linha de tendência horizontal.
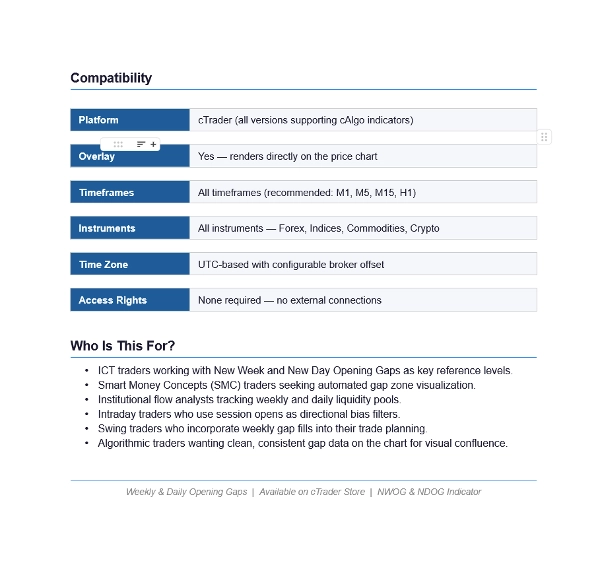
COMPATIBILIDADE
Plataforma: cTrader (todas as versões que suportam indicadores cAlgo)
Sobreposição: Sim — renderiza diretamente no gráfico de preços
Intervalos de tempo: Todos os intervalos (recomendado: M1, M5, M15, H1)
Instrumentos: Todos — Forex, Índices, Commodities, C
PARA QUEM É?
Traders ICT que trabalham com Gaps de Abertura da Nova Semana e Novo Dia como níveis de referência chave
Traders de Smart Money Concepts (SMC) que buscam visualização automatizada de zonas de gap
Analistas de fluxo institucional que acompanham pools de liquidez semanais e diários
Traders intradiários que usam aberturas de sessão como filtros de viés direcional
Traders swing que incorporam preenchimentos de gaps semanais em seu planejamento de trades
Traders algorítmicos que desejam dados de gap limpos e consistentes no gráfico para confluência visual
Resumo
Avaliações de clientes
5 | 0 % | |
4 | 100 % | |
3 | 0 % | |
2 | 0 % | |
1 | 0 % |


![Logótipo de "[Hamster-Coder] Moving Average MTF"](https://cdn.ctrader.com/image/webp/b11b98b1-194d-4b8e-b00e-d611826ad159_31226)


