

Bollinger Bands Advanced
Gösterge
2 satın almalar
Sürüm 1.0, Apr 2026
Windows, Mac
4.0
Değerlendirmeler: 3

32
Satışlar
998
Ücretsiz yüklemeler
Açıklama
Bollinger Bantları Gelişmiş Sıkışma ve Kopuş Sistemi
Bollinger Bantları göstergesi volatilite tüccarları için vazgeçilmezdir, ancak standart bantlar kritik bağlamı dışarıda bırakır: Piyasa sıkışıyor mu? Trend sürmek için yeterince güçlü mü? Hareket aşırı mı uzadı?
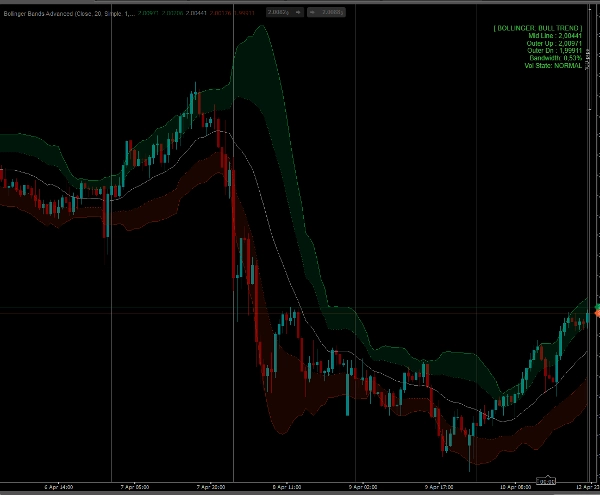
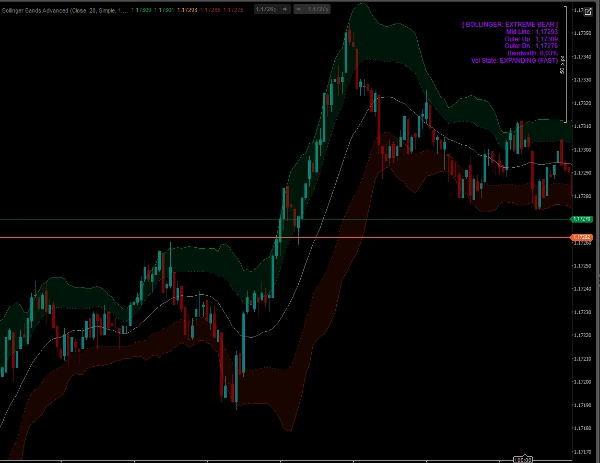
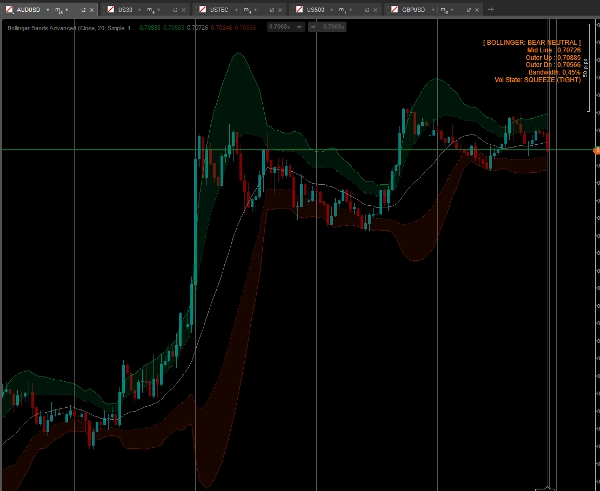
Bollinger Advanced göstergesi standart bantları son derece görsel, profesyonel düzeyde bir ticaret sistemine dönüştürür. Çift Eylem Bölgeleri (Bulutlar), otomatik Volatilite Sıkışma Dedektörü ve Akıllı Boya Çubukları tanıtarak, patlayıcı kopuşları yakalamada ve mükemmel ortalamaya dönüş girişlerini zamanlamada size büyük bir avantaj sağlar.
Temel Özellikler
- Çift Bant Bulut Sistemi (Eylem Bölgeleri): Tek bir dış bant yerine, bu gösterge İç Bant (örneğin, 1 Standart Sapma) ve Dış Bant (örneğin, 2 SS) çizer. Aralarındaki alan Bulut olarak gölgelendirilir.
-
- Fiyat Bulut içinde mi? "Trend Bölgesi"ndesiniz. Momentumun tadını çıkarın!
- Fiyat Orta Hat ile İç Bant arasında mı? "Nötr Bölge"desiniz. Bir kurulum için bekleyin.
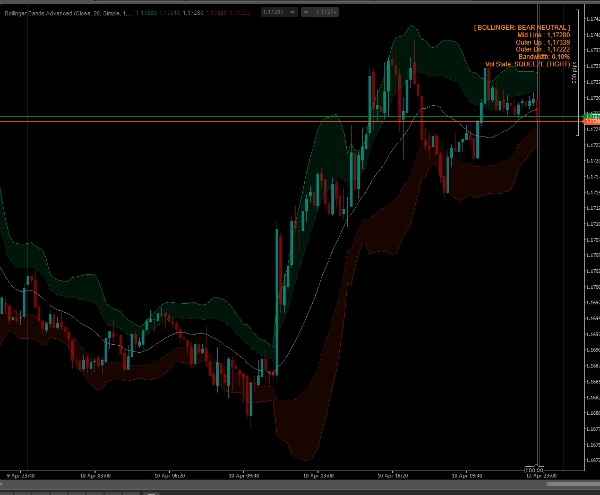
- Otomatik Sıkışma Dedektörü: Gösterge sürekli olarak Bollinger Bant genişliğini hesaplar ve bunu tarihsel hareketli ortalama ile karşılaştırır. Grafik üzerindeki gösterge paneli, bantlar anormal şekilde daraldığında parlak turuncu "SIKIŞMA (DAR)" uyarısı verir ve yaklaşan patlayıcı kopuş konusunda sizi uyarır!
- Akıllı Çubuk Renklendirme (Boya Çubukları): Mumlarınız volatilite ve bant konumuna göre renk değiştirir:
-
- Neon Mor/Magenta (Aşırı): Fiyat Dış Bant dışında kapanır. Büyük bir kopuşun veya aşırı uzanmış bir zirvenin işaretidir.
- Parlak Yeşil/Kırmızı (Trend): Fiyat aktif olarak Bulut Eylem Bölgesi içinde ilerliyor.
- Koyu Yeşil/Kırmızı (Nötr): Fiyat hareketli ortalamaya doğru geri çekiliyor.
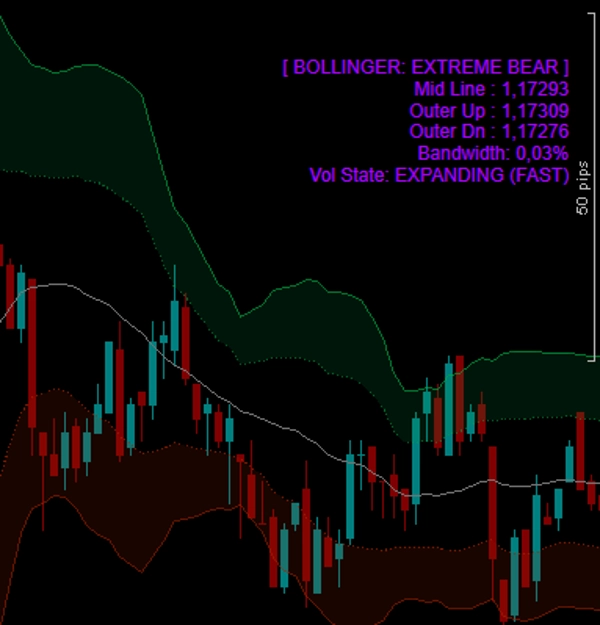
- Gerçek Zamanlı Grafik Üstü Gösterge Paneli: Şık bir panel tam Bant seviyelerini, mevcut Bant genişliği yüzdesini, Piyasa Durumunu ve Volatilite Durumunu (Sıkışma, Normal veya Genişleme) gösterir.
- Tamamen Açık: Herhangi bir sembolde (Forex, Kripto, Endeksler, Hisseler) ve herhangi bir zaman diliminde sıfır sınırlama ile işlem yapın. Ömür boyu erişim.
Nasıl işlem yapılır?
- Kopuş (Sıkışma Oyunu): Gösterge paneline bakın. Volatilite Durumu "SIKIŞMA" dediğinde, piyasa enerji depoluyor demektir. Bir mumun Bulut bölgesine patlayıp Parlak Yeşil/Kırmızı renge dönmesini bekleyin. Bu, yüksek momentumlu bir kopuşa giriş tetikleyicinizdir.
- Trend Takibi: Mumlar Parlak Yeşil/Kırmızı kaldığı ve dış Bulutu sardığı sürece pozisyonda kalın.
- Ortalama Dönüş: Uzun bir trend fiyatı tamamen Dış Bant dışına ittiğinde (mum Mor olur) ve gösterge paneli "GENİŞLEME (HIZLI)" dediğinde, piyasa çok fazla gerilmiş demektir. Orta Hattaki dönüş fiyat hareketini arayın.
Özet
YZ özeti
Bollinger Bands Advanced is a volatility indicator designed to enhance traditional Bollinger Bands by providing deeper market context for trading decisions. It features a Dual-Band Cloud system that shades the area between an Inner Band (e.g., 1 standard deviation) and an Outer Band (e.g., 2 standard deviations), defining distinct market zones: the Trend Zone (price inside the Cloud) and the Neutral Zone (price between the mid-line and Inner Band).
An automatic Volatility Squeeze Detector monitors Bollinger Bandwidth against historical averages and signals a "SQUEEZE (TIGHT)" alert on an on-chart dashboard when volatility contracts, indicating potential explosive breakouts. Candlesticks are color-coded with Smart Paintbars to reflect volatility and band position: neon purple/magenta for extreme moves outside the Outer Band, bright green/red for active trend momentum inside the Cloud, and dark green/red for neutral pullbacks toward the moving average.
The real-time dashboard displays band levels, bandwidth percentage, market state, and volatility state (Squeezing, Normal, Expanding). The indicator supports all symbols and timeframes across Forex, Crypto, Indices, and Stocks without limitations. Trading strategies include breakout entries during squeezes, trend riding within the Cloud, and mean reversion when price is overextended beyond the Outer Band.
An automatic Volatility Squeeze Detector monitors Bollinger Bandwidth against historical averages and signals a "SQUEEZE (TIGHT)" alert on an on-chart dashboard when volatility contracts, indicating potential explosive breakouts. Candlesticks are color-coded with Smart Paintbars to reflect volatility and band position: neon purple/magenta for extreme moves outside the Outer Band, bright green/red for active trend momentum inside the Cloud, and dark green/red for neutral pullbacks toward the moving average.
The real-time dashboard displays band levels, bandwidth percentage, market state, and volatility state (Squeezing, Normal, Expanding). The indicator supports all symbols and timeframes across Forex, Crypto, Indices, and Stocks without limitations. Trading strategies include breakout entries during squeezes, trend riding within the Cloud, and mean reversion when price is overextended beyond the Outer Band.
Gösterge profili
Gösterge kategorisi
Volatilite
Çıktı türü
Sinyaller
Görselleştirme
Filtre
Veri gereklilikleri
Yalnızca çubuklar
Desteklenen sinyaller
Kırılma
Trend gücü
Volatilite
Tartışma
Müşteri değerlendirmeleri
4.0
Değerlendirmeler: 3
5 | 0 % | |
4 | 100 % | |
3 | 0 % | |
2 | 0 % | |
1 | 0 % |
Müşteri değerlendirmeleri
April 20, 2026
demo first, then maybe small size if the notes look sane. The setup needs patience.
April 18, 2026
April 13, 2026
SSS
Bollinger Bands
Channel
ATR
cTrader Store üzerinden erişilebilen işlem botları, göstergeler ve eklentiler gibi ürünler, üçüncü taraf sağlayıcılar tarafından sağlanır ve yalnızca bilgilendirme ve teknik erişim amaçlarıyla sunulur. cTrader Store bir broker değildir ve yatırım tavsiyesi, kişisel öneriler vermez veya gelecekteki performansı garanti etmez.





























Fiyat
32
Satışlar
998
Ücretsiz yüklemeler