
Description
The ultimate candlestick suite is here to help you detect most of the candlestick patters that exist today.
Candlestick patterns, which are technical trading tools, have been used for centuries to predict price direction. There are various candlestick patterns used to determine price direction and momentum, including three line strike, two red gapping, three red crows, evening star, and abandoned baby.
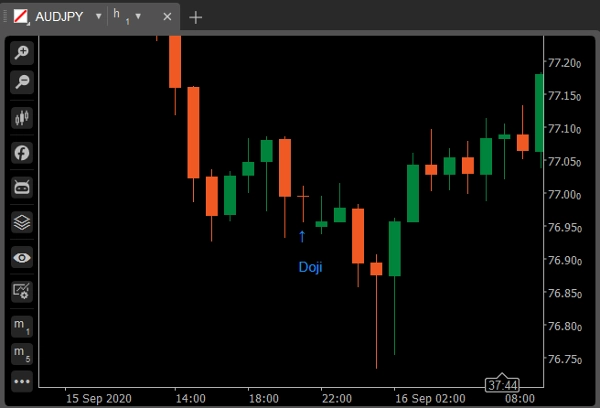
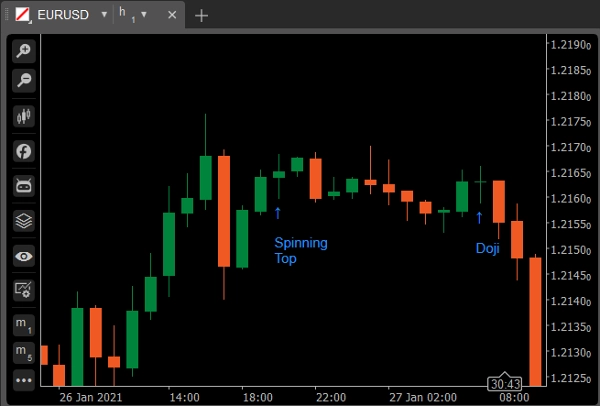
Doji
A doji candlestick forms when a security's open and close are virtually equal for the given time period and generally signals a reversal pattern for technical analysts. The body threshold is at a maximum of 5% of the total length.
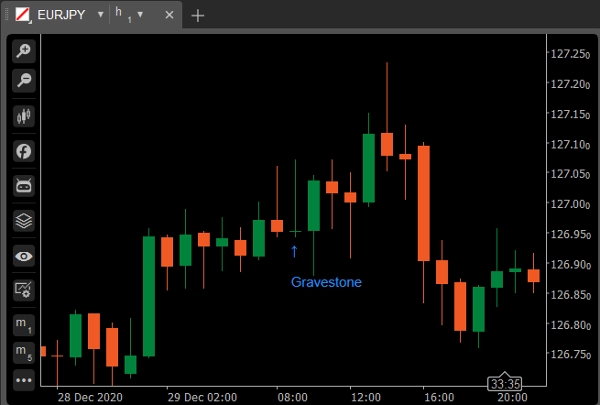
Variation: Gravestone Doji
It's formed when the asset's high, open, and close prices are (almost) the same. The long lower shadow suggests that there was aggressive selling during the period of the candle, but since the price closed near the open it shows that buyers were able to absorb the selling and push the price back up.
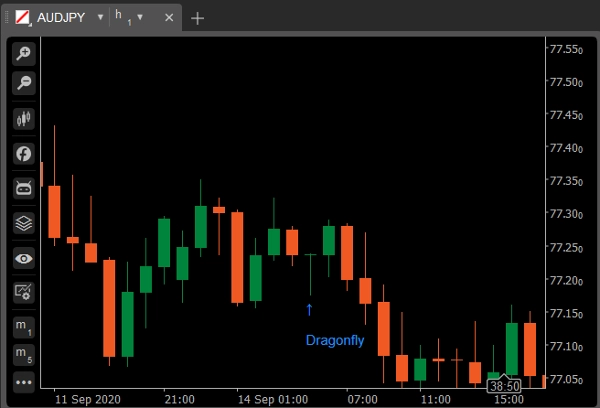
Variation: Dragonfly Doji
A gravestone doji occurs when the low, open, and close prices are (almost) the same, and the candle has a long upper shadow. The gravestone looks like an upside-down "T." The implications for the gravestone are the same as the dragonfly. Both indicate possible trend reversals but must be confirmed by the candle that follows.
Spinning Top
A spinning top is a candlestick pattern with a short real body that's vertically centered between long upper and lower shadows. The candlestick pattern represents indecision about the future direction of the asset. Neither the buyers nor the sellers could gain the upper hand. The body threshold is at a maximum of 20% of the total length.
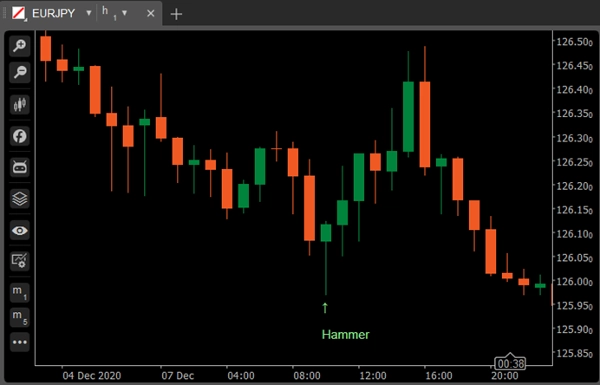
Hammer
Hammer A green or red candlestick that consists of a small body near the high with little or no upper shadow and a long lower tail. Considered a bullish pattern during a downtrend.
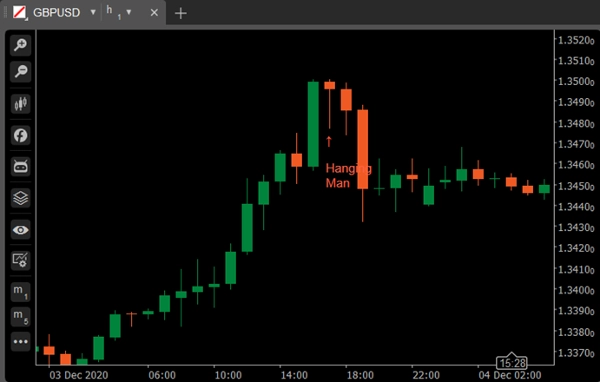
Variation: Hanging Man
A green or red candlestick that consists of a small body near the high with little or no upper shadow and a long lower tail. Considered a bearish pattern during an uptrend.
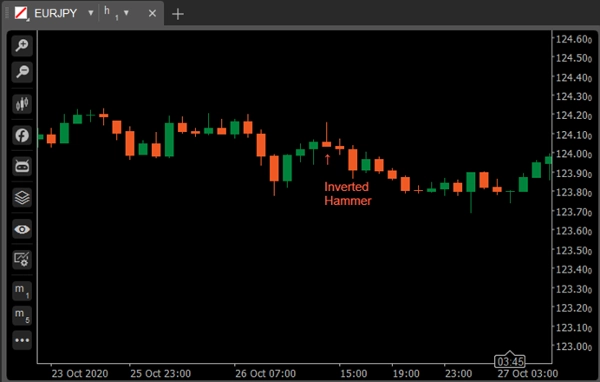
Inverted Hammer
The inverted hammer is a type of candlestick pattern found after a downtrend and is usually taken to be a trend-reversal signal.
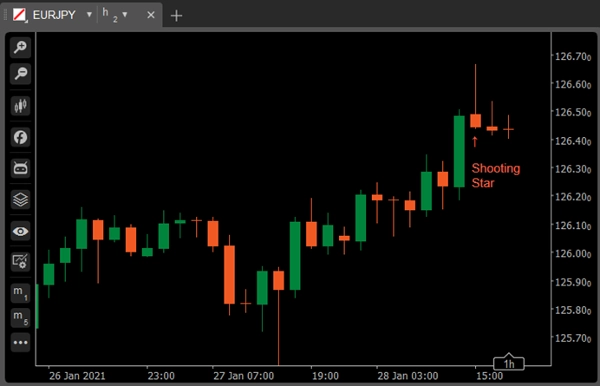
Variation: Shooting Star
The Shooting Star looks exactly the same as the Inverted hammer, but instead of being found in a downtrend it is found in an uptrend and thus has different implications.
Marubozu
A long or normal candlestick (red or green) with no shadow or tail. The high and the low represent the opening and the closing prices. Considered a continuation pattern.
Variation: Marubozu Open
As for the Marubozu open, the opening price should be flat: i.e. the price action should move only in one direction, but unlike the Marubozu full candle, the closing price on the other side can slightly differ from the high/low. In other words, the open should be flat, while there is room for a short wick on the other side.
Variation: Marubozu Close
The Marubozu close candle is opposite to the Marubozu open: the close should be flat while the price action can slightly move in the other direction before it starts aggressively trading in one direction.
Bullish Engulfing
Consists of a smaller red body that is contained within the following large green candlestick. When it appears at the bottom it is interpreted as a major reversal signal.
Bearish Engulfing
Consists of a smaller green body that is contained within the following large red candlestick. When it appears at the top it is considered a major reversal signal.
Piercing Line
Piercing Line Consists of a red candlestick followed by a green candlestick that opens lower than the low of the preceding but closes more than halfway into the red body candlestick. It is considered a reversal signal when it appears at the bottom.
Dark Shadow Cover
Consists of a long green candlestick followed by a red candlestick that opens above the high of the green candlestick and closes well into the body of the green candlestick. It is considered a bearish reversal signal during an uptrend.
Bullish Harami
Consists of an unusually large red body followed by a small green body (contained within large red body). It is considered a bullish pattern when preceded by a downtrend.
Variation: Bullish Harami Cross
A large red body followed by a Doji. It is considered a reversal signal when it appears at the bottom.
Bearish Harami
Bearish Harami Consists of an unusually large green body followed by a small red body (contained within a large green body). It is considered a bearish pattern when preceded by an uptrend.
Variation: Bearish Harami Cross
A large green body followed by a Doji. Considered a reversal signal when it appears at the top.
Bullish/Bearish Kicker
The Bullish Kicker signal often occurs after a major surprise in the news that is announced before or after market hours. Something drastic has happened, causing a great shift in investor sentiment, and a reversal will inevitably follow. The larger the gap between the two candles, the more significant the signal.
Morning/Evening Star
Consists of a large green body candlestick followed by a small body candlestick (red or green) that gaps above the previous. The third is a red body candlestick that closes well within the large green body. It is considered a reversal signal when it appears at the top level.
Variation: Abandoned Baby
Three Green Soldiers/Three Red Crows
Consists of three long green candlesticks with consecutively higher closes. The closing prices are near to or at their highs. When it appears at the bottom it is interpreted as a bottom reversal signal.
Consists of three long red candlesticks with consecutively lower closes. The closing prices are near to or at their lows. When it appears at the top it is considered a top reversal signal.
Three Line Strike
A three line strike is a continuation group of candlesticks that has three in the direction of a trend followed by a final candle that pulls back to the start point. Traders use the three line strike as an opportunity to buy at a recent trend low or sell at a recent high.
Two Red Gapping
The bearish two red gapping continuation pattern appears after a notable top in an uptrend, with a gap down that yields two red bars posting lower lows. This pattern predicts that the decline will continue to even lower lows.
Summary
Customer reviews
5 | 100 % | |
4 | 0 % | |
3 | 0 % | |
2 | 0 % | |
1 | 0 % |


