
ADXMultiframeIndicator
Indicator
1 purchases
Version 1.0, Oct 2025
Windows, Mac
5.0
Reviews: 2
Description
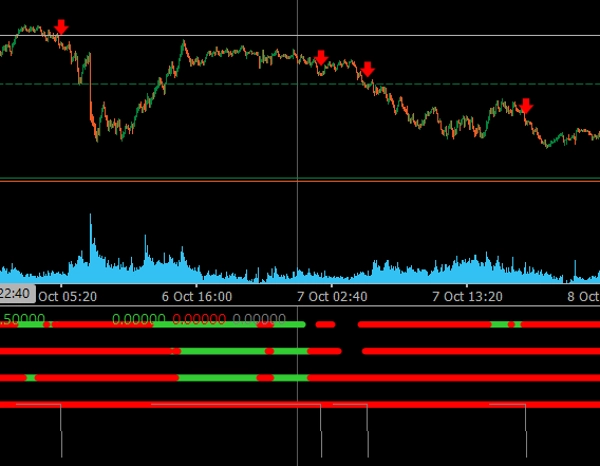
The Multi-Timeframe ADX Trend Dots & Arrows is a professional trading indicator for cTrader, designed to identify aligned market trends across multiple timeframes using the Average Directional Movement Index (ADX).
🔹 Key Features:
- ✅ Analyze up to 4 customizable timeframes (M15, H1, H4, Daily).
- ✅ Colored dots show directional bias (Green = Uptrend, Red = Downtrend).
- ✅ Automatic arrows appear when all timeframes align in the same direction.
- ✅ Consecutive bars filter reduces false or premature signals.
- ✅ Clean, modern visualization optimized for both dark and light chart themes.
- ✅ Perfect for spotting multi-timeframe confirmations and trend continuation points.
This indicator is ideal for traders who want to see the bigger picture and enter only when all timeframes agree, providing stronger and more reliable trade setups.
Summary
AI summary
The ADXMultiframeIndicator is a trading indicator for the cTrader platform that identifies market trends by analyzing the Average Directional Movement Index (ADX) across multiple timeframes. It supports up to four customizable timeframes, including M15, H1, H4, and Daily. The indicator displays colored dots to indicate directional bias—green for uptrends and red for downtrends—and automatically shows arrows when all selected timeframes align in the same direction. A consecutive bars filter is included to reduce false or premature signals. The visualization is designed to be clear and modern, compatible with both dark and light chart themes. This tool assists traders in confirming multi-timeframe trends and identifying trend continuation points by highlighting when all timeframes agree, facilitating more informed trade entries. It is particularly useful for analyzing indices markets.
Indicator profile
Customer reviews
5.0
Reviews: 2
5 | 100 % | |
4 | 0 % | |
3 | 0 % | |
2 | 0 % | |
1 | 0 % |
Customer reviews
October 28, 2025
the first signal should not decide the only input, but it can look better than it is during a lucky run.
Discussion
FAQ
Indices
Products available through cTrader Store, including trading bots, indicators and plugins, are provided by third-party developers and made available for informational and technical access purposes only. cTrader Store is not a broker and does not provide investment advice, personal recommendations or any guarantee of future performance.
More from this author


Price
Since 21/01/2025
3
Sales