trPDHLC
"trPDHLC" logo
03/09/2025
1
Desktop
Since 08/03/2025
Sales
1

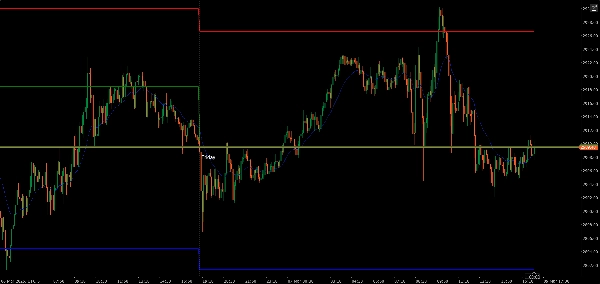
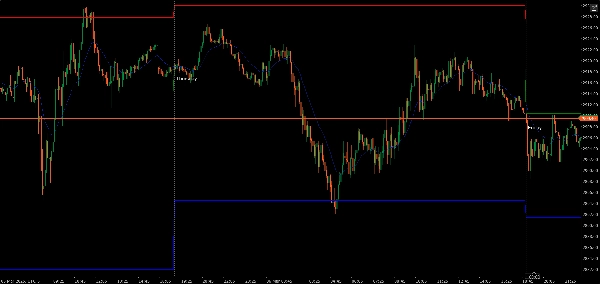
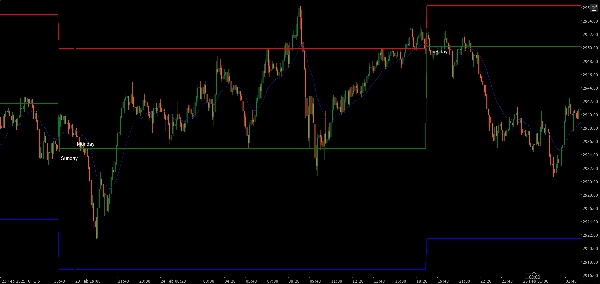
previous day high low and closed indicator.

blue line show previous day low.

red line show previous day high.

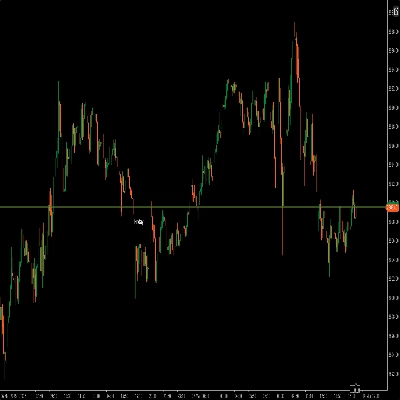
green line show previous day closed.

0.0
Reviews: 0
Customer reviews
No reviews for this product yet. Already tried it? Be the first to tell others!
More from this author
period seperate
daily period separate indicator.
You may also like
Indicator
Breakout
BreakOut_Probability_Expo
Break Out Probability Experimental indicator. Credits for this indicator goes to Zeiierman !!!
Indicator
Indices
Prop
Stocks
+6
New Way Sar - Pro
The Parabolic SAR, or "Stop and Reverse," is a dynamic technical analysis tool
VGM - Auto Fibo Retracement
Auto Fibonacci Retracement Indicator.
Indicator
RSI
Breakout
Supertrend
Swing Levels
🔍 Automatically detect support and resistance levels based on "swings" or pivots
Indicator
Grid
NAS100
NZDUSD
+16
3D HeikenAshi bY Mohammad KHR
Clean 3D, Sleek Candles for Trend Patterns.
Indicator
Indices
AI
Machine Learning Momentum Index
The Machine Learning Momentum Index (MLMI) represents the next step in oscillator trading.
Indicator
Indices
RSI
Bollinger
Clustering
Clustering tool for traders with visual insights into market patterns.
Indicator
Forex
EURUSD
USDJPY
4 Currencies V2_NSC
Relative Currency Strength 4 Currencies: AUD USD EUR JPY
Indicator
RSI
Breakout
XAUUSD
+4
Dynamic Market Structure Analysis of Turning Points
Identify market structure effortlessly with swing highs, lows, CHoCH, and BOS levels for smart trading decisions! 📊🔍"
Flex VWAP
Flexible VWAP indicator with timezone-aware, custom time periods and automatic DST handling.
SmartFibonacci
SmartFibonacci — automatic Fibonacci retracements & extensions with swing detection, alerts and clean labels for cTrader
Indicator
Signal
Half Trend BT
Half Trend BT by BullittTraders
Supply Demand - BasicV1
Supply and demand zones. They're important. Here's a free version to get you started!
Indicator
Signal
Scalping
Major Tops and Bottoms
Average accuracy of around 60% to 70% on 45min timeframes it is highly recommended to use stop losses
MMXM Structure by Ludwig
MMXM Structure by LudwigICT – Professional Market Structure Mapping Tool
Indicator
NAS100
Indices
XAUUSD
+4
BSL_SSL_Liqudity
Buy-Side & Sell-Side Liquidity (BSL/SSL) Indicator
Renko 4k Pips
Custom your Renko Brick how do you wish!
Indicator
Indices
ATR
Forex
+1
[Stellar Strategies] Market Regime Filter
Filters market regimes (trend/range/pullback) using MAs, ADX, ATR/BBW Vol, opt. Volume. Helps adapt strategy. 📉📈