
Description
indicator that colors candles in real-time based on market structure and draws liquidity zones, institutional flows, and consolidation ranges. Designed for traders who operate under Smart Money Concepts (SMC) principles.
🧠 Algorithm Logic
https://chartshots.spotware.com/c/69f0e3fd81319
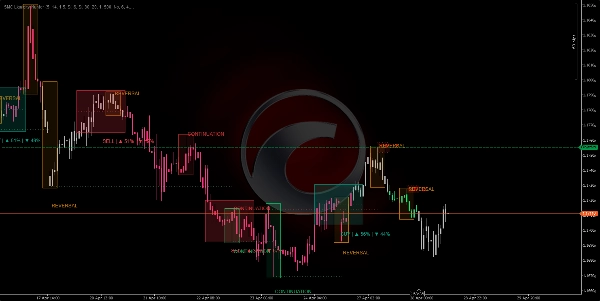
1. Market Structure Detection 🔍
- Finds pivots (local highs and lows) using a configurable lookback period.
- Compares consecutive pivots to determine structure:
- Higher Highs + Higher Lows = Bullish Bias 📈
- Lower Highs + Lower Lows = Bearish Bias 📉
- Mixed signals = Neutral Bias ➡️
- Filters noise: only counts pivots that move beyond a threshold based on ATR (Average True Range) multiplied by adjustable sensitivity.
https://chartshots.spotware.com/c/69f0e7e752b74
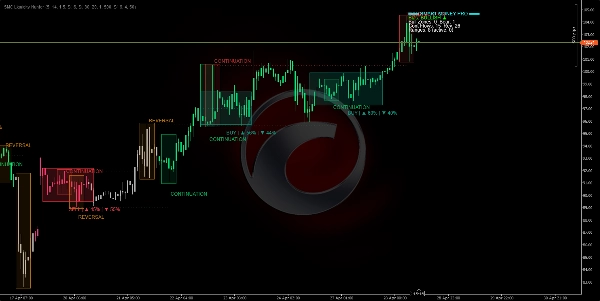
2. Institutional Flows (Flow Boxes) 🔄
- Every time a new significant pivot forms, the algorithm draws a horizontal line from the previous pivot to the new one.
- Classifies the flow as:
- Continuation: price respects the trend (HL in uptrend, LH in downtrend) ✅
- Reversal: price breaks structure (LL in uptrend, HH in downtrend) ⚠️
- Draws a colored box around the pivot labeled "CONTINUATION" or "REVERSAL".
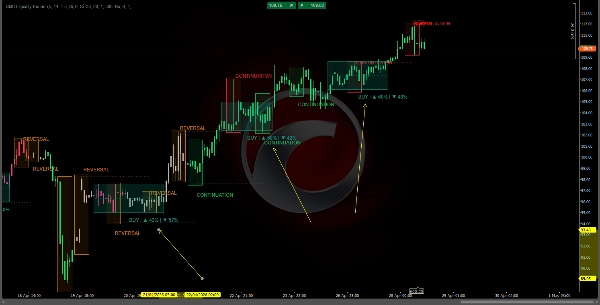
3. Supply/Demand Zones (Liquidity) 💧
https://chartshots.spotware.com/c/69f0e8e7aef29
- Around each significant pivot, a horizontal band is drawn extending into the future for a configurable number of bars.
- These zones represent unexecuted institutional orders:
- Bearish pivots → SUPPLY zone (sell orders) 🔴
- Bullish pivots → DEMAND zone (buy orders) 🟢
- A zone breaks and disappears when price penetrates it with enough force or when its lifespan expires.
4. Range Detection Engine (Consolidations) 📦
- Calculates a Simple Moving Average (SMA) with an ATR band around it.
- If every single bar within a lookback window stays inside the band, the algorithm identifies a consolidation range.
- Draws a blue rectangle with:
- Dotted midline (range equilibrium) ⚖️
- Breakout probability percentage bullish/bearish based on:
- Directional momentum (ADX/DI+ vs DI-) 📐
- Cumulative bullish vs bearish volume inside the range 📊
- Time spent in upper vs lower half ⏱️
5. Candle Coloring (Clean & Visual) 🕯️
- Green candle = confirmed bullish structure (HH+HL) 🟢
- Magenta/Red candle = confirmed bearish structure (LH+LL) 🔴
- Gray candle = neutral or transitional phase ⚪
- No overlapping rectangles: real wicks and bodies are fully visible at all times.
📋 Dashboard (corner)
Numeric summary of active zones, flows & ranges
🛠️ How to Use It
⚙️ Recommended Settings
- Timeframe: H1 or higher (ideal for Smart Money).
- Default parameters: work well for Forex, indices, and crypto.
- Adjust sensitivity: increase for volatile markets, decrease for choppy sideways markets.
📗 Trading Rules :
✅ Long Entry (BUY)
- Candles must be green (bullish bias active) 🟢
- Price touches or approaches an active "DEMAND" zone 🟢
- A "CONTINUATION" box (not "REVERSAL") appears at that zone ✅
- Dashboard shows bullish breakout probability > 60% on the active range (if any) 📊
✅ Short Entry (SELL)
- Candles must be magenta/red (bearish bias active) 🔴
- Price touches or approaches an active "SUPPLY" zone 🔴
- A "CONTINUATION" box (not "REVERSAL") appears at that zone ✅
- Dashboard shows bearish breakout probability > 60% 📊
❌ Do NOT Trade If...
- Candles are gray (no defined bias) ⚪
- A "REVERSAL" signal appears right where you were about to enter ⚠️
- Price is inside a blue range with no clear breakout yet 🔵
- Dashboard shows opposite confluence (bearish confluence on a bullish setup, or vice versa) 🔄
📈 Dashboard Interpretation
text
═══ SMART MONEY PRO ═══
Bias: BULLISH ▲ ← Current market bias
Bull Zones: 2 Bear: 1 ← Active liquidity zones
Cont Flows: 3 Rev: 0 ← Continuations vs reversals
Ranges: 4 (active: 1) ← Total and active ranges
Active Range ▲65% ▼35% ← Breakout probability
⚡ BULLISH CONFLUENCE ← Maximum alignment signal
💡 Key Principles
- ✅ No repaint: everything is calculated using only closed bar data.
- ✅ Clean chart: colored real candles, semi-transparent zones, no visual clutter.
- ✅ Structure preview: candle color tells you the market phase before pivots are obvious.
- ✅ Built-in confluence: when active zone + active range + flow signal all align, the dashboard explicitly flags it for you.
Summary
Key features include:
- **Institutional Flows:** Draws horizontal lines and colored boxes between significant pivots, labeling flows as "CONTINUATION" or "REVERSAL" to indicate trend respect or break.
- **Supply and Demand Zones:** Highlights unexecuted institutional orders with horizontal bands around pivots, distinguishing supply (sell) and demand (buy) zones that expire or break upon price penetration.
- **Range Detection:** Identifies consolidation ranges using an SMA with ATR bands, marking them with blue rectangles and providing breakout probability percentages based on momentum, volume, and time distribution.
- **Dashboard:** Displays numeric summaries of active zones, flows, ranges, and breakout probabilities, including confluence signals when multiple factors align.
Recommended for use on H1 or higher timeframes, the indicator suits Forex, indices, and cryptocurrencies. It operates without repainting by relying on closed bar data and maintains a clean chart presentation with visible candle wicks and bodies.
Customer reviews
5 | 50 % | |
4 | 0 % | |
3 | 0 % | |
2 | 50 % | |
1 | 0 % |


