
TradingViewMACD
Indicator
3 purchases
Version 1.0, Feb 2025
Windows, Mac
5.0
Reviews: 1

Description
TradingViewMACD Indicator
Elevate your trading strategy with our highly customizable TradingViewMACD indicator, designed for the cAlgo platform. This powerful tool combines the flexibility and precision needed to optimize your market analysis.
Key Features:
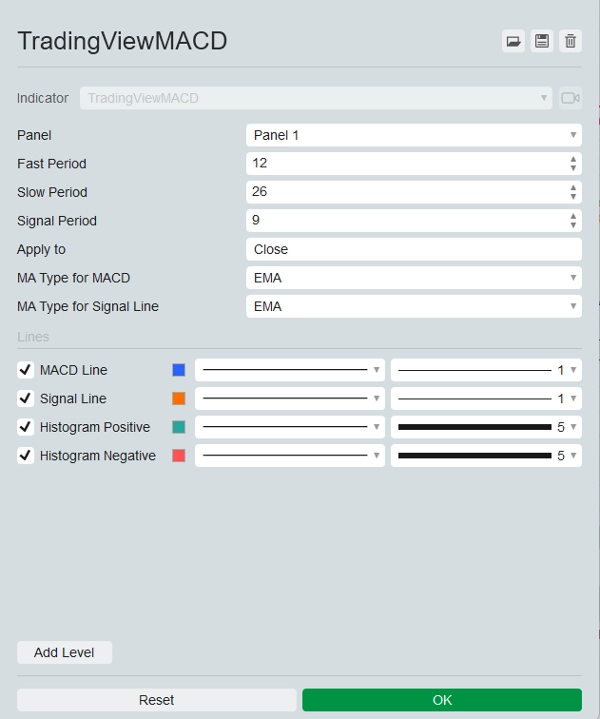
- Customizable Parameters:
- Fast Period: Adjust the fast moving average period to suit your trading style.
- Slow Period: Configure the slow moving average period for enhanced signal accuracy.
- Signal Period: Set the signal line period to fine-tune your entry and exit points.
- Applied Price: Choose from open, high, low, close, median, typical, or weighted prices to apply the indicator.
- Multiple Moving Average Types:
- Select between Simple Moving Average (SMA) and Exponential Moving Average (EMA) for both the MACD line and signal line, providing flexibility in your analysis.
- Visual Outputs:
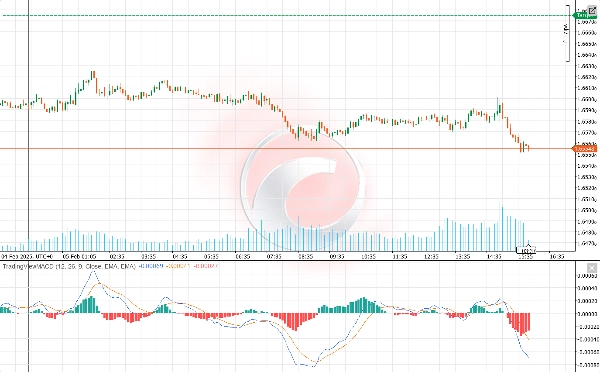
- MACD Line: Displayed in a striking blue color for clear visibility.
- Signal Line: Highlighted in vibrant orange to easily distinguish from the MACD line.
- Histogram: Differentiates between positive and negative values with green and red colors respectively, offering a clear visual representation of market momentum.
- Enhanced Market Insights:
- The indicator calculates the difference between the fast and slow moving averages to generate the MACD line.
- Computes the signal line as the moving average of the MACD line.
- The histogram visually represents the difference between the MACD line and the signal line, helping you identify potential buy and sell signals.
- User-Friendly:
- Easy to install and configure, allowing traders of all levels to benefit from its advanced features.
- Comprehensive documentation and customer support to ensure a seamless experience.
Unleash the full potential of your trading strategy with the TradingViewMACD indicator. Enhance your market analysis, make informed decisions, and stay ahead of the curve with this essential trading tool.
Summary
AI summary
The TradingViewMACD indicator for the cAlgo platform is a customizable technical analysis tool designed to enhance market analysis. It calculates the difference between fast and slow moving averages to generate the MACD line, computes a signal line as the moving average of the MACD line, and displays a histogram representing the difference between these lines to help identify potential buy and sell signals.
Key features include adjustable parameters such as fast period, slow period, signal period, and applied price (open, high, low, close, median, typical, or weighted). Users can select between Simple Moving Average (SMA) and Exponential Moving Average (EMA) types for both the MACD and signal lines, providing analytical flexibility.
Visual outputs consist of a blue MACD line, an orange signal line, and a histogram with green and red colors indicating positive and negative momentum, respectively. The indicator is designed for ease of installation and configuration, supported by comprehensive documentation and customer support to accommodate traders of all experience levels.
Indicator profile
Customer reviews
5.0
Reviews: 1
5 | 100 % | |
4 | 0 % | |
3 | 0 % | |
2 | 0 % | |
1 | 0 % |
Customer reviews
November 9, 2025
TradingView MACD brings the familiar feel straight to cTrader 🚀 - smooth, light, and 100% accurate to the original. Perfect for traders switching from TV who love clean momentum signals. Missing alerts, but flawless for classic trend and divergence play.
Discussion
FAQ
Signal
MACD
Products available through cTrader Store, including trading bots, indicators and plugins, are provided by third-party developers and made available for informational and technical access purposes only. cTrader Store is not a broker and does not provide investment advice, personal recommendations or any guarantee of future performance.


Price
Since 22/11/2024
140
Sales
2.61K
Free installs