


Description
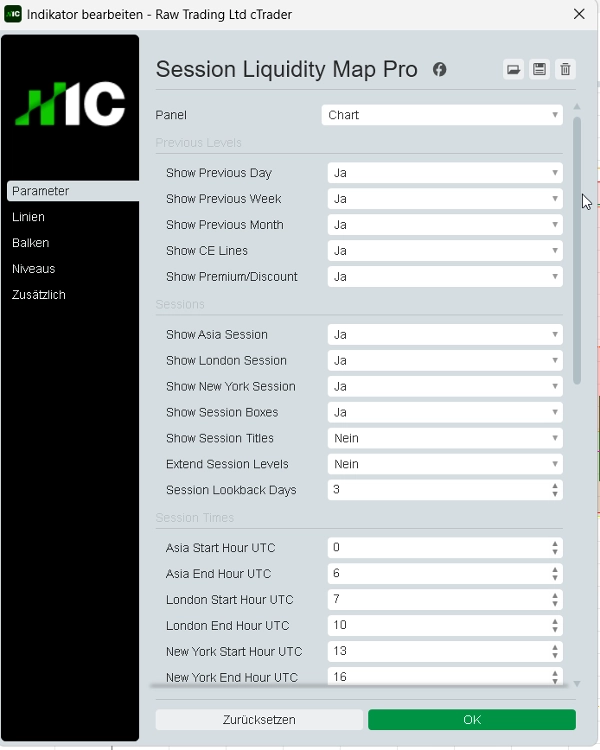
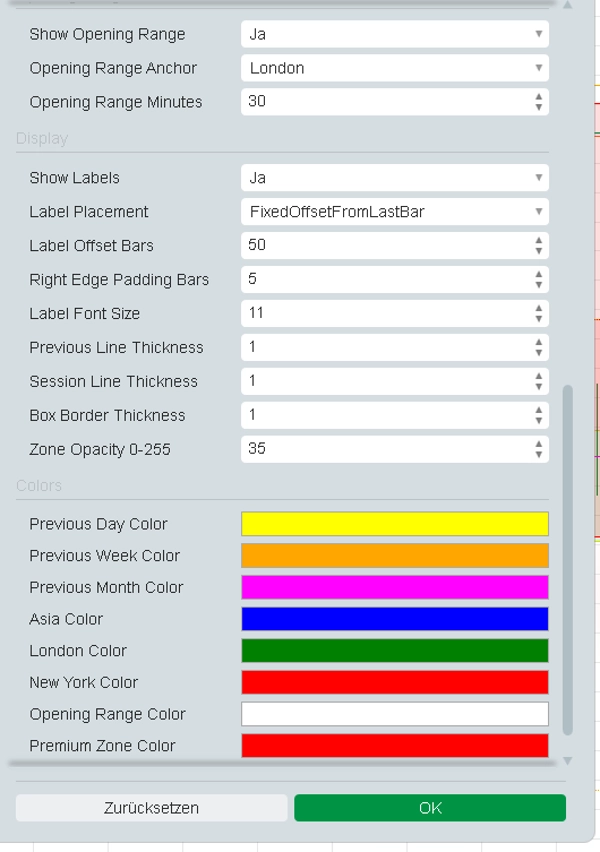
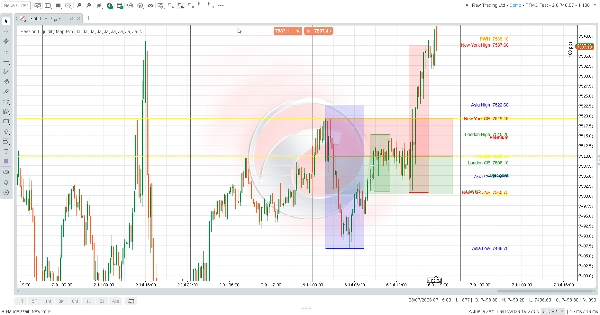
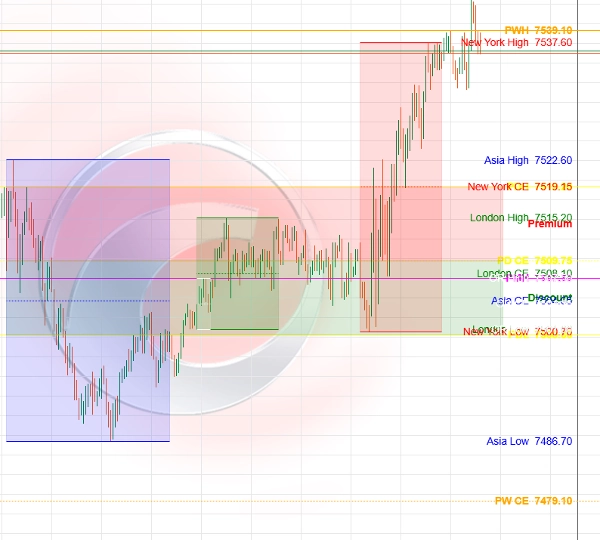
Session Liquidity Map Pro is a visual cTrader indicator for structured price action analysis. It automatically displays previous day, week and month highs/lows with equilibrium levels, Asia/London/New York session ranges, opening range levels and premium/discount zones.
The indicator is designed for chart preparation, liquidity-based analysis, market structure review and backtesting research. It does not execute trades, does not provide buy/sell signals and does not require Full Access.
Trading involves risk. Past performance does not guarantee future results.
Summary
AI summary
Session Liquidity Map Pro is a visual indicator for the cTrader platform designed to enhance structured price action analysis. It automatically maps key market data on your chart, including previous day, week, and month highs and lows, equilibrium levels, and session ranges for Asia, London, and New York. The indicator also highlights opening range levels and premium/discount zones, aiding in liquidity-based analysis and market structure review.
This tool supports chart preparation and backtesting research by visually presenting critical price levels and zones relevant to market participants. It does not execute trades or provide buy/sell signals and operates without requiring full access permissions. The indicator is categorized under market structure and provides visual outputs to assist traders in identifying liquidity sweeps, market structure shifts, key levels, and premium/discount areas.
Session Liquidity Map Pro is suitable for traders focusing on market structure concepts and price action analysis, offering a comprehensive overview of session dynamics and historical price points to inform trading decisions.
This tool supports chart preparation and backtesting research by visually presenting critical price levels and zones relevant to market participants. It does not execute trades or provide buy/sell signals and operates without requiring full access permissions. The indicator is categorized under market structure and provides visual outputs to assist traders in identifying liquidity sweeps, market structure shifts, key levels, and premium/discount areas.
Session Liquidity Map Pro is suitable for traders focusing on market structure concepts and price action analysis, offering a comprehensive overview of session dynamics and historical price points to inform trading decisions.
Indicator profile
Indicator category
Market structure (SMC)
Output type
Visualisation
Data requirements
Bars only
Supported signals
Reversal
Breakout
Trend strength
Level touch
Level break
Session opening range
Customer reviews
0.0
Reviews: 0
Customer reviews
No reviews for this product yet. Already tried it? Be the first to tell others!
Discussion
FAQ
Premium/Discount
Supertrend
Key Levels
MSS
Liquidity Sweep
Market Structure
Products available through cTrader Store, including trading bots, indicators and plugins, are provided by third-party developers and made available for informational and technical access purposes only. cTrader Store is not a broker and does not provide investment advice, personal recommendations or any guarantee of future performance.


























Price
4
Sales