"Killzone-Indicator" logo
Indicator
Version 1.0, Apr 2026
Windows, Mac
4.0
Reviews: 1
"Killzone-Indicator" uploaded image
Since 07/10/2025
1
Sales

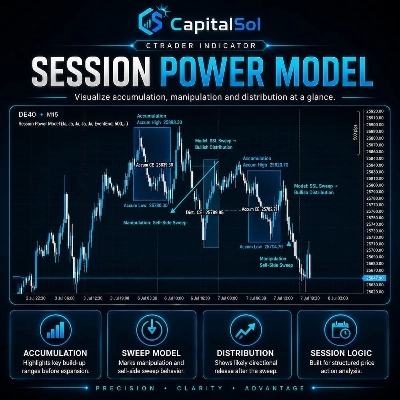
Killzone Session Indicator — Asia · London · New York · NY PM

Automatically highlights all four major ICT Killzone sessions directly on your cTrader chart. No manual drawings, no missed windows — the indicator calculates and displays every session zone in real time.

─────────────────────────────

KEY FEATURES

─────────────────────────────

► Four Sessions

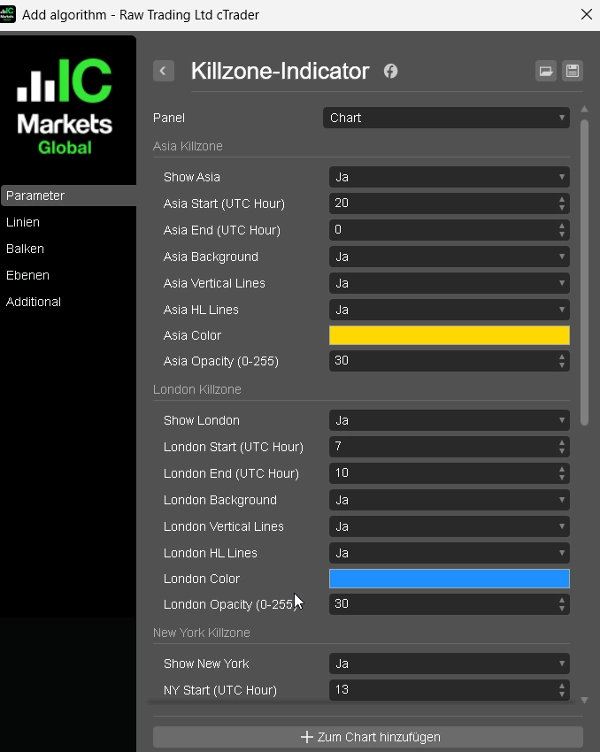
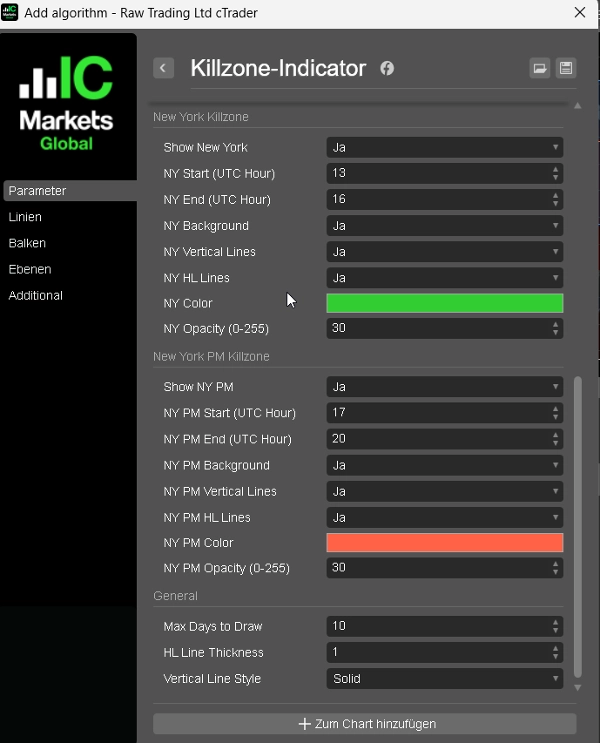
Asia, London, New York, and New York PM — each session is fully independent with its own start time, end time, color, and toggle.

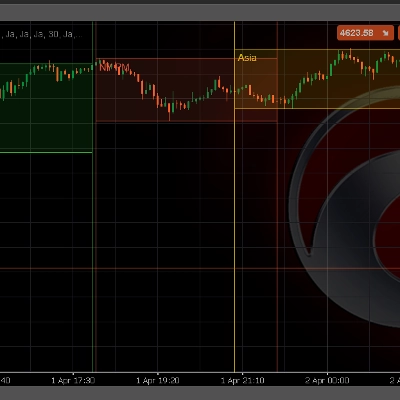
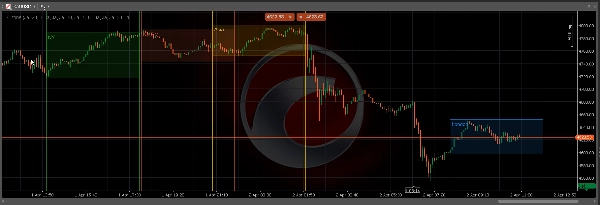
► Background Highlight

Optional filled rectangle for each session zone — instantly identify the active Killzone on any timeframe.

► High / Low Lines

Clear horizontal lines at the session High and Low — the key levels for manipulation, reversal, and entry confirmation.

► Vertical Boundary Lines

Optional vertical lines at session open and close — for clean visual separation between sessions.

► Free Color Choice

Each session has its own native cTrader color picker with adjustable opacity (0–255).

► Configurable Lookback

Draw up to 60 days of historical session zones — ideal for backtesting and session analysis.

─────────────────────────────

DEFAULT SESSION TIMES (UTC)

─────────────────────────────

Asia → 20:00 – 00:00

London → 07:00 – 10:00

New York → 13:00 – 16:00

NY PM → 17:00 – 20:00

All times are fully adjustable to match your broker's server time.

─────────────────────────────

HOW TO USE

─────────────────────────────

1. Attach the indicator to any chart and timeframe.

2. Adjust session times to match your broker's server time (UTC by default).

3. Enable or disable Background, Vertical Lines, and HL Lines per session.

4. Choose your preferred color and opacity for each session.

5. Set Max Days to control how many historical sessions are drawn.

The session High and Low levels are your primary reference points — use them for Killzone entries, stop placement, and liquidity targets.

─────────────────────────────

IDEAL FOR

─────────────────────────────

✔ ICT / SMC traders working with Killzone concepts

✔ Session-based manipulation and reversal analysis

✔ Order Block and Fair Value Gap confluence trading

✔ FTMO / prop firm traders who need clear session structure

─────────────────────────────

COMPATIBILITY

─────────────────────────────

Platform : cTrader (Windows & Mac)

Language : C# / cAlgo

Timeframes : All (M1 to W1)

Instruments: Forex, Gold, Indices, Crypto

Indicator profile
Indicator category
Market structure (SMC)
Output type
Visualisation
Data requirements
Bars only
Supported signals
Cross
Breakout
Reversal
Level break
Session opening range
4.0
Reviews: 1
5
0 %
4
100 %
3
0 %
2
0 %
1
0 %
Customer reviews
April 5, 2026
The decision feels less rushed, but the stop still matters.
Forex
Breakout
Indices
EURUSD
Commodities
GBPUSD
NZDUSD
Prop
Fair Value Gap
SMC
Stocks
XAUUSD
NAS100
USDJPY
Products available through cTrader Store, including trading bots, indicators and plugins, are provided by third-party developers and made available for informational and technical access purposes only. cTrader Store is not a broker and does not provide investment advice, personal recommendations or any guarantee of future performance.

More from this author

Indicator
SMC
Prop
+6
Automatically draws the Opening Range (High & Low) for Tokyo, London, and New York sessions. Configurable start times,
Indicator
SMC
Prop
+12
Shows bullish/bearish bias for 5 timeframes in one panel. Three bias methods, alignment summary, fully configurable.
Indicator
ATR
SMC
+12
ATR-based SL and TP1/2/3 levels with pip labels and R-multiples. Essential risk tool for FTMO and prop firm traders.

You may also like

Indicator
SMC
Forex
+5
Detects Break of Structure (BOS) and Change of Character (CHOCH)
Indicator
Grid
Prop
+5
Automatically draws major, minor, and trace support/resistance levels at round numbers
Indicator
Prop
Forex
+7
The Parabolic SAR, or "Stop and Reverse," is a dynamic technical analysis tool.
Indicator
Customizable window inside your platform, access to any website Calendar
Indicator
ATR
Prop
+15
🚀 Adaptive trailing stop that uses logarithmic normalized volatility....
Indicator
Prop
Forex
+4
Pivot Points Standard — All-in-One Multi-Timeframe Pivot Indicator for cTrader
Indicator
AI
ATR
+26
MacD Custom Indicator-Multiple Time Frame
Indicator
RSI
Forex
+2
Candle Pro, Perfect for scalping, intraday, and swing trading.
Indicator
Support & Resistance
Multi-Timeframe exhaustion indicator. Detects trend loss with Doji filter & dynamic volatility.
Indicator
Prop
Forex
+4
Draws pivots (P, S/R, CPR) from selected anchors like H1–Month1, with optional mid-levels (PS1, S1S2, etc.)
Indicator
RSI
MACD
This indicator is a combination of MACD and RSI into one. This is perfect fusion and powerful indicator ever.
Indicator
RSI
Volume
Scan RSI across multiple timeframes/symbols with real-time Telegram alerts and interactive visual mini-charts.
Indicator
ADX
ATR
+5
Signal Quality Score - 0-100 filter combining RSI, Volume, ATR, Trend Strength & Alignment. Works on ANY chart type.
Indicator
MACD
Prop
+14
Customize the MACD! Choose colors, get real-time tick updates, and see crossover points for enhanced trading precision.
Indicator
Indicator calculates spread in pips
Indicator
AI
SMC
+13
Dynamic Liquidity Depth exposes hidden volume
Indicator
Aggressive
Supertrend
+5
Stop trading with tunnel vision! 🚫 The Heat Map Dashboard is an institutional-grade visual trading assistant
Indicator
XAUUSD
Professional Volume Profile Indicator - Shows volume distribution, POC, Value Areas & Buy/Sell pressure.
Since 07/10/2025
1
Sales