
คำอธิบาย
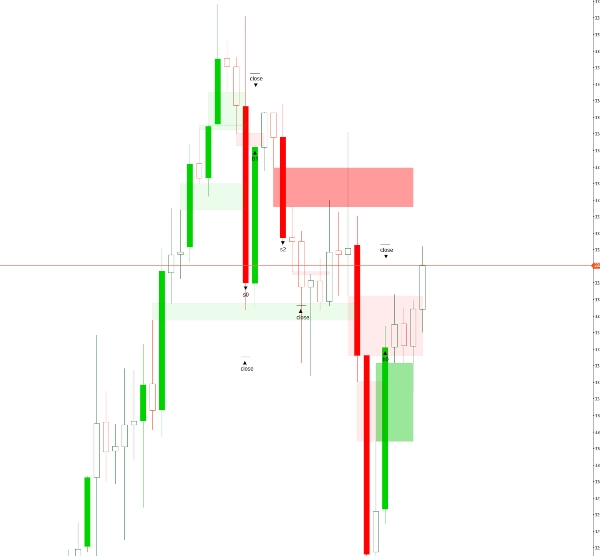
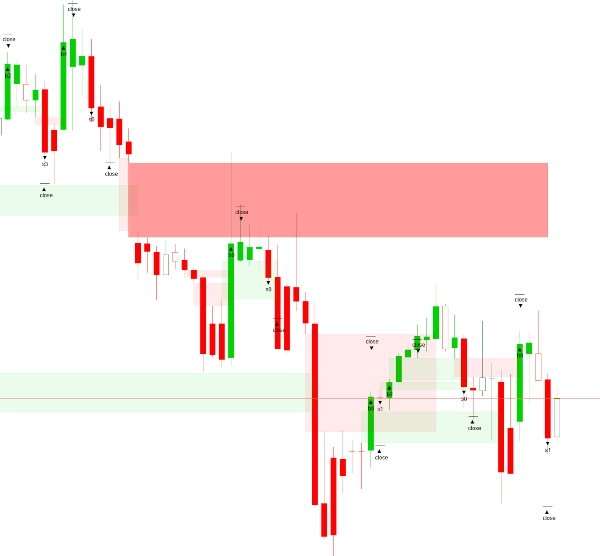
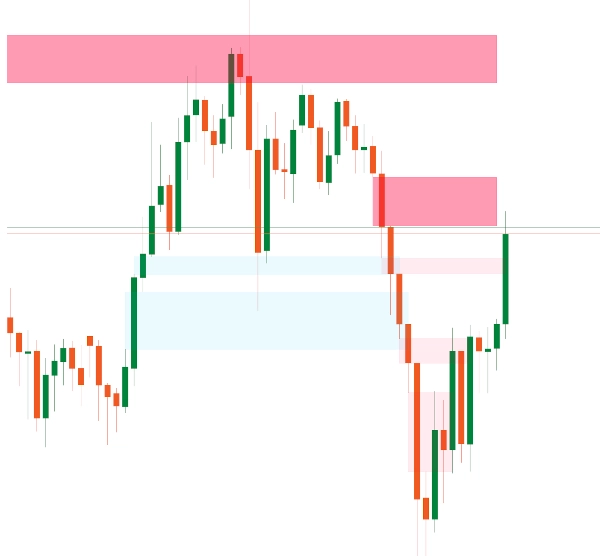
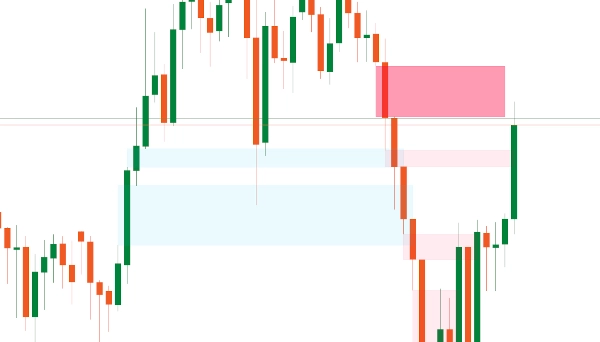
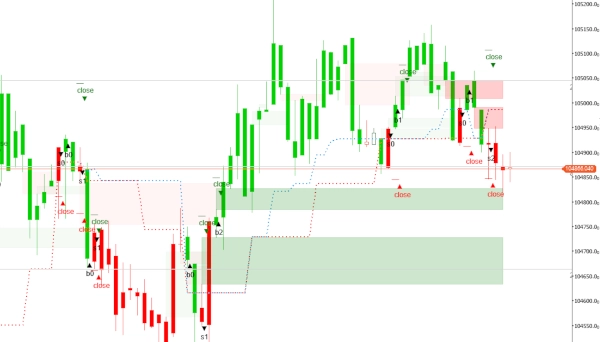
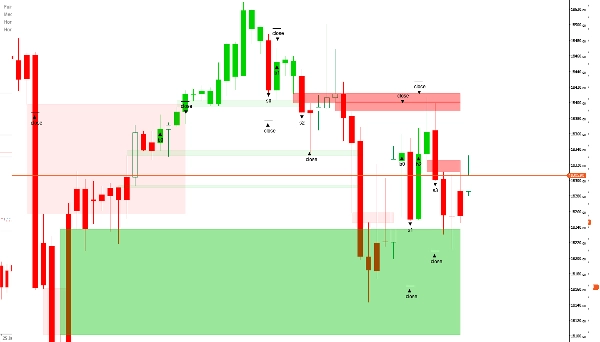
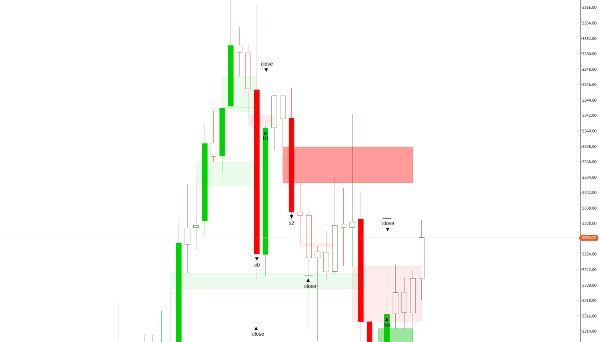
ตัวบ่งชี้ Fair Value Gap (FVG) นี้เป็นเครื่องมือวิเคราะห์ทางเทคนิคที่ออกแบบมาเพื่อตรวจจับความไม่สมดุลของราคาในตลาดการเงิน มันระบุพื้นที่ที่ราคาพุ่งขึ้นหรือลดลงอย่างรวดเร็ว ทิ้ง “ช่องว่าง” — โซนที่มีการซื้อขายน้อยหรือไม่มีเลย ช่องว่างเหล่านี้มักบ่งชี้ถึงความไม่สมดุลชั่วคราวของอุปสงค์และอุปทาน ซึ่งบ่งชี้ว่าราคาอาจกลับมา “เติมเต็ม” ช่องว่างนั้นในที่สุดเมื่อตลาดแสวงหาความสมดุล โดยทั่วไป FVG จะถูกจดจำเมื่อแท่งเทียนราคาปิดสูงกว่าจุดสูงสุดหรือต่ำกว่าจุดต่ำสุดของแท่งเทียนก่อนหน้าอย่างมีนัยสำคัญโดยไม่มีการทับซ้อนกัน ซึ่งบ่งชี้ถึงพื้นที่ที่อาจเกิดปฏิกิริยา พฤติกรรมนี้มักเกี่ยวข้องกับการซื้อขายของสถาบันหรือกิจกรรมอัลกอริทึม ในขณะที่เวอร์ชันส่วนใหญ่ของตัวบ่งชี้นี้วิเคราะห์ความไม่สมดุลในกรอบเวลาหนึ่งเดียว เวอร์ชันพรีเมียมเพิ่มความยืดหยุ่นโดยตรวจจับและแสดงช่องว่างจากกรอบเวลาที่สูงกว่าหรือต่ำกว่าโดยตรงบนแผนภูมิปัจจุบัน ให้บริบทที่ลึกซึ้งยิ่งขึ้นสำหรับการวิเคราะห์หลายกรอบเวลา
ภาพรวมการตั้งค่า
- จำนวนแท่งที่โหลด: กำหนดจำนวนแท่งประวัติศาสตร์ที่จะวิเคราะห์ โดยเริ่มจากแท่งที่เพิ่งเสร็จสิ้นล่าสุดและย้อนกลับไป
- สีของ FVG ขาขึ้น: กำหนดสีสำหรับ FVG ที่ปรากฏในแนวโน้มขาขึ้น โดยใช้ความโปร่งใส 30% เพื่อให้เห็นองค์ประกอบด้านหลังช่องว่างได้
- สีของ FVG ขาลง: กำหนดสีสำหรับ FVG ที่ปรากฏในแนวโน้มขาลง โดยใช้ความโปร่งใส 30% เพื่อความชัดเจนบนแผนภูมิ
คุณสมบัติพรีเมียม (มีในเวอร์ชันที่ชำระเงิน)
- ลบช่องว่างที่ปิดแล้ว: การตั้งค่าแบบบูลีน—เมื่อเปิดใช้งาน ("yes") จะลบช่องว่างที่ปิดทั้งหมดโดยอัตโนมัติ; หากปิดใช้งาน ("no") ช่องว่างจะยังคงมองเห็นได้ ซึ่งมีประโยชน์อย่างยิ่งในกรอบเวลาที่ต่ำกว่า (ต่ำกว่า 20 นาที)
- แก้ไข/ลบช่องว่าง: อนุญาตให้ผู้ซื้อขายปรับหรือ ลบช่องว่างด้วยตนเอง ซึ่งช่วยให้ผู้ซื้อขายที่มีประสบการณ์ควบคุมได้มากขึ้น โดยเฉพาะอย่างยิ่งเนื่องจากช่องว่างขนาดเล็กมักมีผลกระทบต่อการเคลื่อนไหวของราคาน้อย
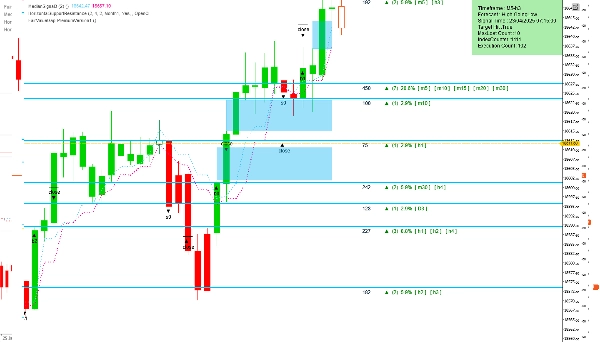
- ตั้งค่ากรอบเวลา: มีสองตัวเลือก—ใช้กรอบเวลาของแผนภูมิปัจจุบันหรือเลือกกรอบเวลาอื่นสำหรับการวิเคราะห์ ในขณะที่ยังแสดงผลลัพธ์บนแผนภูมิหลัก ฟีเจอร์นี้ช่วยให้ผู้ซื้อขายได้รับข้อมูลเชิงลึกที่รวดเร็วขึ้นเกี่ยวกับการเคลื่อนไหวของตลาดที่เป็นไปได้
- กรอบเวลาที่เลือก: กำหนดกรอบเวลาที่ต้องการสำหรับการวิเคราะห์หากเลือก "Selected Timeframe" ในการตั้งค่าข้างต้น
- ความแม่นยำของช่องว่างขนาดเล็ก: ให้ผู้ซื้อขายป้อนขนาดช่องว่างที่ต้องการเป็นจำนวนเต็ม ช่วยให้ระบุช่องว่างที่ในอดีตนำไปสู่ผลลัพธ์ที่ดี ค่าอิงตามชุดข้อมูลทั้งหมดและขนาดช่องว่างที่สังเกตได้สำหรับสินทรัพย์นั้น
โดยค่าเริ่มต้น ตัวบ่งชี้จะสแกนความไม่สมดุลทั้งหมดภายในกรอบเวลาเดียว อย่างไรก็ตาม การเข้าถึงคุณสมบัติพรีเมียมผ่าน FairValueGapPremium เวอร์ชันสามารถเพิ่มขีดความสามารถในการวิเคราะห์ได้อย่างมาก
สรุป
This indicator detects such gaps to highlight potential reaction zones. By default, it analyzes imbalances within a single timeframe. The premium version enhances functionality by allowing detection and display of FVGs from higher or lower timeframes directly on the current chart, supporting multi-timeframe analysis.
Key settings include the number of historical bars to analyze and customizable colors for bullish and bearish gaps with transparency for chart clarity. Premium features offer options to automatically delete closed gaps, manually edit or remove gaps, select analysis timeframes independent of the chart’s timeframe, and specify gap size accuracy to focus on significant gaps.
This tool aids traders in identifying price inefficiencies and probable market reaction areas through detailed gap analysis across multiple timeframes.
รีวิวจากลูกค้า
5 | 100 % | |
4 | 0 % | |
3 | 0 % | |
2 | 0 % | |
1 | 0 % |


!["[Hamster-Coder] Moving Average MTF" โลโก้](https://cdn.ctrader.com/image/webp/b11b98b1-194d-4b8e-b00e-d611826ad159_31226)


!["Gaussian Channel [Iridio Capital]" โลโก้](https://cdn.ctrader.com/image/webp/7c039209-5573-4a54-a072-f9528b503103_41960)

