
HorizontalSupportResistance
지표
778 다운로드
버전 1.0, Apr 2025
Windows, Mac
4.5
리뷰: 2
설명
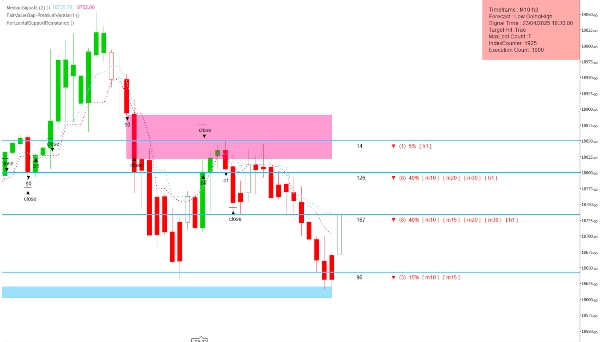
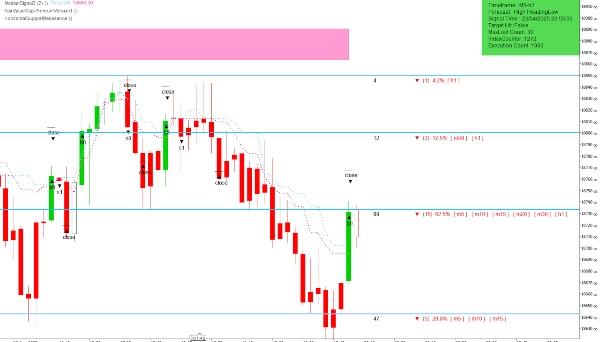
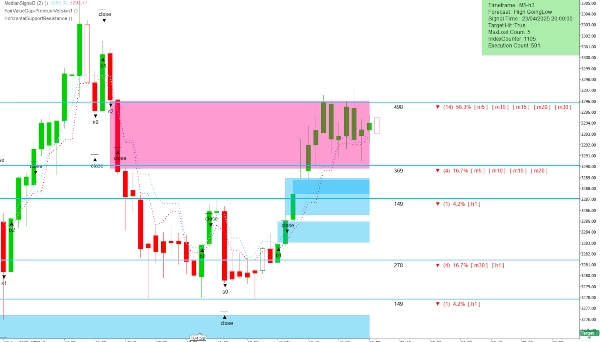
이 특별한 다중 시간대 지지 및 저항 지표는 시장 마법과 다름없습니다. 정밀하게 설계되고 스마트한 논리에 기반하여, 모든 외환, 지수 또는 주식, 특히 NASDAQ100에서 놀라운 정확도로 중요한 가격 수준을 식별합니다. 숙련된 트레이더의 직관이 시각적 도구에 인코딩된 것처럼, 가격이 반응하거나 반전하거나 가속하는 주요 구역을 강조하여 거의 초자연적인 우위를 제공합니다. 깔끔한 캔들스틱 표현과 생생하고 명확하게 표시된 수준으로 이 지표는 단순히 시장을 따르는 것이 아니라 시장을 예측합니다. 단기 움직임을 스캘핑하든 장기 포지션을 유지하든, 이 도구는 개인 거래 오라클처럼 조용히 더 스마트하고 자신감 있는 결정을 내리도록 안내합니다.
요약
AI 요약
HorizontalSupportResistance is a multi-timeframe indicator designed to identify critical horizontal support and resistance levels across various markets including forex, indices, and stocks, with particular accuracy on the NASDAQ100. It visually highlights key price zones where the market tends to react, reverse, or accelerate, using clear candlestick representations and distinct level markings. The indicator supports trading strategies ranging from short-term scalping to longer-term position holding by providing anticipatory signals of potential price movements. It is suitable for use on multiple asset classes such as forex pairs (e.g., GBPUSD), stock indices, and equities, helping traders recognize important price levels to inform their decisions.
지표 프로필
고객 리뷰
4.5
리뷰: 2
5 | 50 % | |
4 | 50 % | |
3 | 0 % | |
2 | 0 % | |
1 | 0 % |
고객 리뷰
August 12, 2025
Pros: Accurate auto SR levels, customizable appearance, lightweight. Cons: No level strength filter, no alerts, possible chart clutter.
June 20, 2025
The Indicator is excellent, What's the core logic of this Indicator, Kindly share if you don't mind.
상담
자주 묻는 질문(FAQ)
Forex
Scalping
Indices
GBPUSD
Stocks
트레이딩 봇, 지표, 플러그인 등 cTrader Store에서 제공되는 상품은 제3자 개발자에 의해 제공되며, 이는 단순히 정보 및 기술적 접근을 목적으로 제공된 것입니다. cTrader Store는 중개인이 아니며, 투자 조언, 개인별 추천 또는 향후 성과에 대한 어떠한 보장도 제공하지 않습니다.


가격
가입일 19/04/2025
284.21M
거래량
1.08M
핍 수익
8
판매
3.46K
무료 설치