
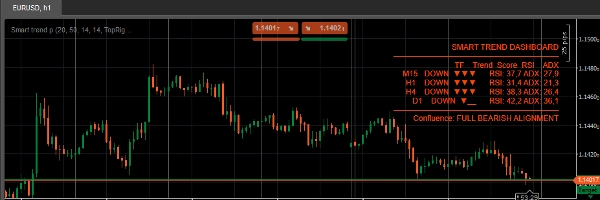
설명
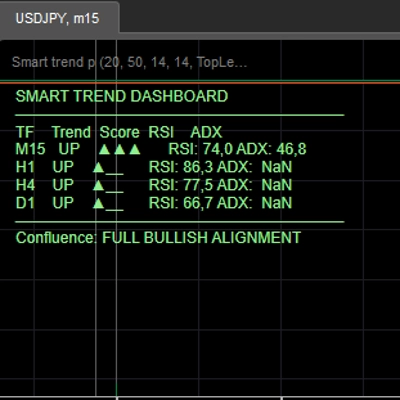
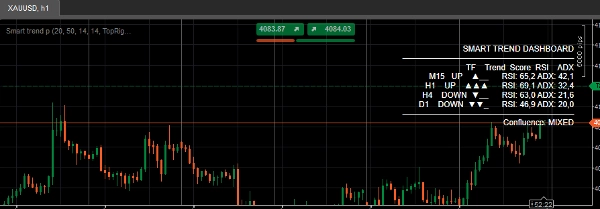
추세가 실제로 유지되는지 확인하기 위해 차트 시간대를 계속 전환하지 마세요. 스마트 트렌드 대시보드는 M15, H1, H4, D1을 동시에 스캔하여 EMA 방향, DI+/DI- 확인, RSI 모멘텀을 혼합한 각 시간대별 단일 복합 점수(-3에서 +3)를 제공합니다 — ADX가 약하고 변동이 심한 추세를 걸러내어 잡음에 속지 않도록 합니다.
주요 기능:
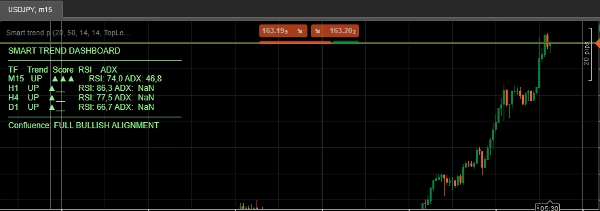
- 차트에 직접 표시되는 실시간 다중 시간대 패널 (M15 / H1 / H4 / D1)
- 시간대별 복합 추세 점수 — 해석할 네 개의 지표가 아닌 하나의 숫자
- 한눈에 즉시 파악할 수 있는 시각적 강도 바 (▲▲▲ / ▼▼_)
- ADX 기반 점수 조정 — 약하거나 변동이 심한 추세는 자동으로 약화됨
- 완전한 합류 감지 — 모든 시간대가 일치할 때 표시
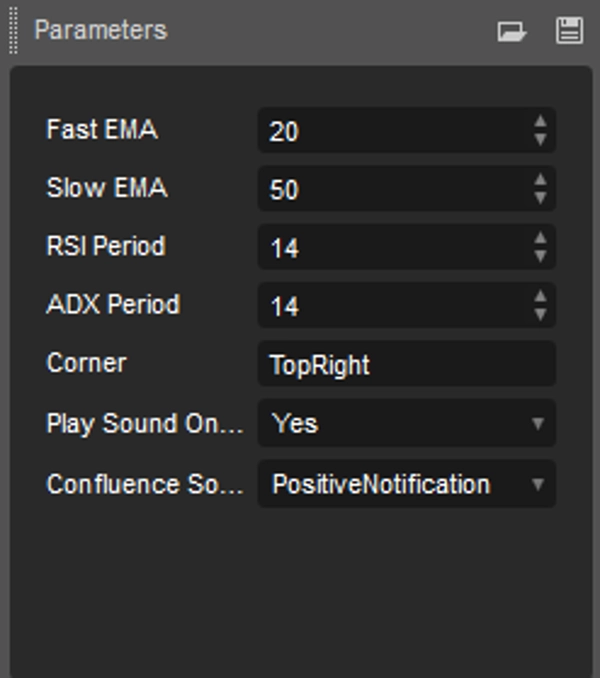
- 완전한 강세/약세 정렬 시 사운드 알림
- 색상 코드 패널 (녹색 = 강세 정렬, 빨강 = 약세, 흰색 = 혼합)
- 경량 — 재도색 없음, 바 마감 시 업데이트
대상 사용자:
거래 전에 다중 시간대 확인을 사용하는 재량 거래자 및 반자동 시스템 구축자들이 수동 대신 자동으로 그 확인을 원할 때 적합합니다.
요약
AI summary
Smart Trend Dashboard is a multi-timeframe indicator for cTrader that evaluates trend direction, momentum, and strength across four timeframes: M15, H1, H4, and D1. It provides a composite trend score ranging from -3 to +3 per timeframe, integrating EMA direction, DI+/DI- confirmation, and RSI momentum, while using ADX to filter out weak or choppy trends. The dashboard displays these scores visually with strength bars and color-coded panels (green for bullish, red for bearish, white for mixed), enabling quick assessment of market conditions without switching chart timeframes.
Key features include a live panel directly on the chart, ADX-gated scoring to reduce noise, full confluence detection that flags when all timeframes align, and sound alerts for complete bullish or bearish alignment. The indicator updates on bar close and does not repaint, making it suitable for discretionary traders and semi-automated system builders who rely on multi-timeframe confirmation before entering trades.
Key features include a live panel directly on the chart, ADX-gated scoring to reduce noise, full confluence detection that flags when all timeframes align, and sound alerts for complete bullish or bearish alignment. The indicator updates on bar close and does not repaint, making it suitable for discretionary traders and semi-automated system builders who rely on multi-timeframe confirmation before entering trades.
지표 프로필
지표 카테고리
추세
출력 유형
시각화
신호
데이터 요구 사항
막대만
지원되는 신호
추세 강도
고객 리뷰
0.0
리뷰: 0
고객 리뷰
이 상품에 대한 리뷰가 아직 없습니다. 이미 사용해 보셨나요? 다른 사람들에게 가장 먼저 소개해 주세요!
상담
자주 묻는 질문(FAQ)
ADX
EMA
Supertrend
SMA
RSI
Moving Average
트레이딩 봇, 지표, 플러그인 등 cTrader Store에서 제공되는 상품은 제3자 개발자에 의해 제공되며, 이는 단순히 정보 및 기술적 접근을 목적으로 제공된 것입니다. cTrader Store는 중개인이 아니며, 투자 조언, 개인별 추천 또는 향후 성과에 대한 어떠한 보장도 제공하지 않습니다.
이 작성자의 상품 더 보기















!["Gaussian Channel [Iridio Capital]" 로고](https://cdn.ctrader.com/image/webp/2c4f9ca9-4e9b-476d-b5a6-787c8095032b_61546)


가격
가입일 30/05/2026
1
판매