
Daily Weekly Monthly - Highs & Lows
지표
5 구매
버전 1.0, Sep 2024
Windows, Mac
5.0
리뷰: 2
설명
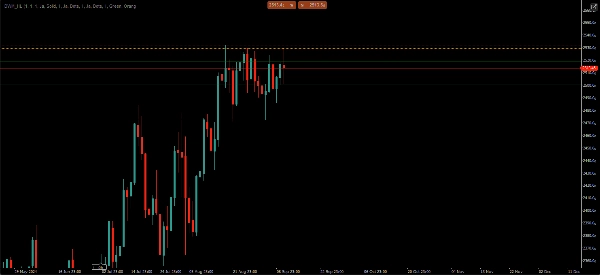
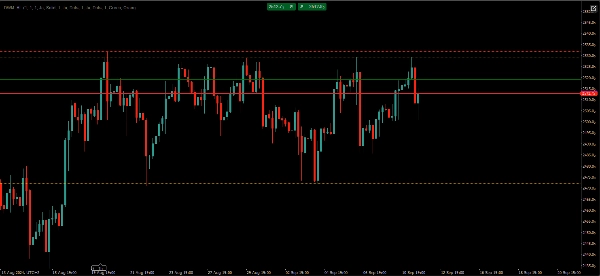
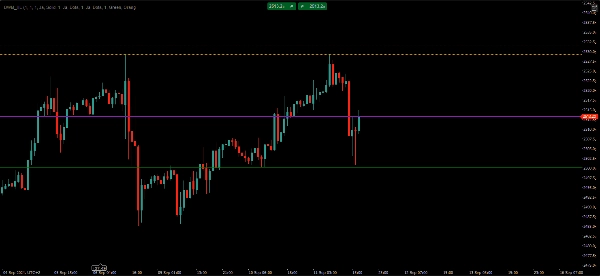
NGS 유동성 수준 – 일간 • 주간 • 월간 최고점 및 최저점
무작위 선이 아닌 유동성을 중심으로 거래하세요.
NGS 유동성 수준은 모든 차트에 가장 중요한 일간, 주간 및 월간 유동성 수준을 자동으로 표시합니다.
• 수동 그리기 없음
• 시간대 전환 없음
• 차트 혼잡 없음
이 사용자 친화적인 지표는 트레이더가 몇 초 만에 주요 유동성 및 시장 구조 수준을 식별하는 데 도움을 줍니다. 매일 수동으로 최고점과 최저점을 표시하는 대신 가장 중요한 수준이 자동으로 표시되고 업데이트됩니다.
특징:
• 자동 일간 최고점 및 최저점 수준
• 자동 주간 최고점 및 최저점 수준
• 자동 월간 최고점 및 최저점 수준
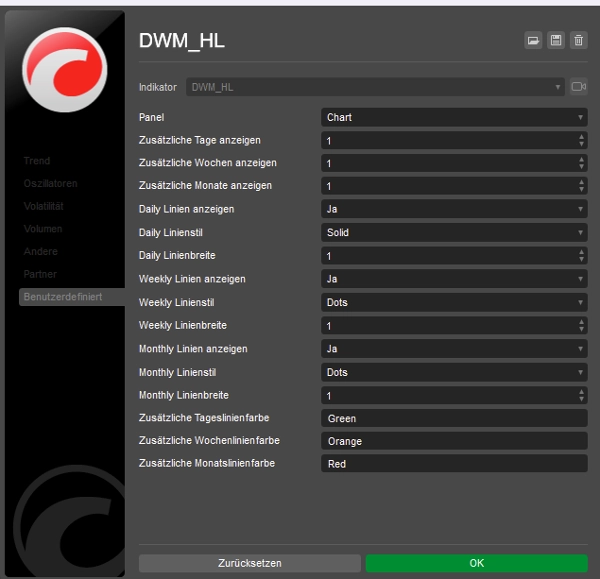
• 선택적 이전 기간 수준
• 사용자 지정 가능한 색상 및 선 스타일
• 깔끔하고 가벼운 차트 표시
• 외환, 지수, 원자재 및 암호화폐 전반에서 작동
• 다중 시간대 지원
• 리페인팅 없음
시장 구조, 유동성 및 상위 시간대 수준에 집중하는 트레이더를 위해 설계되었습니다.
신호 없음.
전략 없음.
수익 보장 없음.
단지 객관적인 유동성 수준과 더 깔끔한 거래 워크플로우.
요약
AI 요약
The Daily Weekly Monthly - Highs & Lows indicator automatically displays key high and low price levels from the most recent and previous daily, weekly, and monthly periods on trading charts. It supports multiple timeframes and markets including Forex, Indices, Commodities, Stocks, and Crypto. Users can customize line colors and styles for each period to maintain a clean, uncluttered chart layout. This indicator provides a clear visual representation of important liquidity and market structure levels, aiding traders in identifying crucial support and resistance zones without manual drawing or timeframe switching. It is non-repainting and designed for objective analysis without signals or trading strategies.
지표 프로필
지표 카테고리
지지 및 저항
출력 유형
시각화
데이터 요구 사항
막대만
고객 리뷰
5.0
리뷰: 2
5 | 100 % | |
4 | 0 % | |
3 | 0 % | |
2 | 0 % | |
1 | 0 % |
고객 리뷰
September 18, 2024
A 5 minute check should not become a 30 minute rabbit hole, and the process is easier to respect.
September 16, 2024
A week of notes gives a better read, and the routine feels easier to keep.
상담
자주 묻는 질문(FAQ)
BTCUSD
Forex
Indices
Commodities
Stocks
XAUUSD
Support & Resistance
트레이딩 봇, 지표, 플러그인 등 cTrader Store에서 제공되는 상품은 제3자 개발자에 의해 제공되며, 이는 단순히 정보 및 기술적 접근을 목적으로 제공된 것입니다. cTrader Store는 중개인이 아니며, 투자 조언, 개인별 추천 또는 향후 성과에 대한 어떠한 보장도 제공하지 않습니다.
이 작성자의 상품 더 보기

좋아하실 만한 다른 항목

!["Smart Money Concepts (SMC) [Iridio Capital]" 로고](https://cdn.ctrader.com/image/webp/28b69fd1-ef54-4bed-9487-07e78e883be4_40934)


가격
가입일 11/09/2024
7
판매