
설명
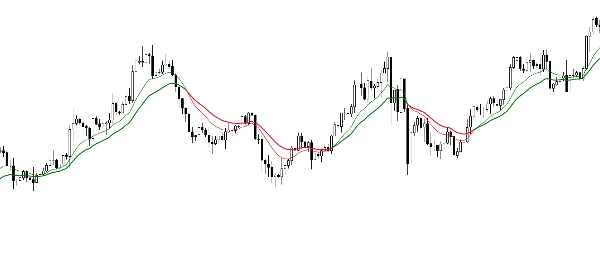
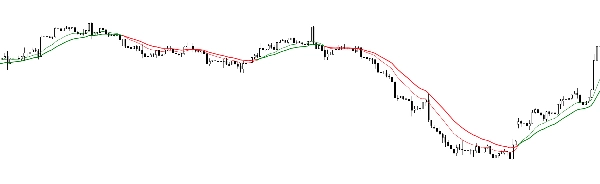
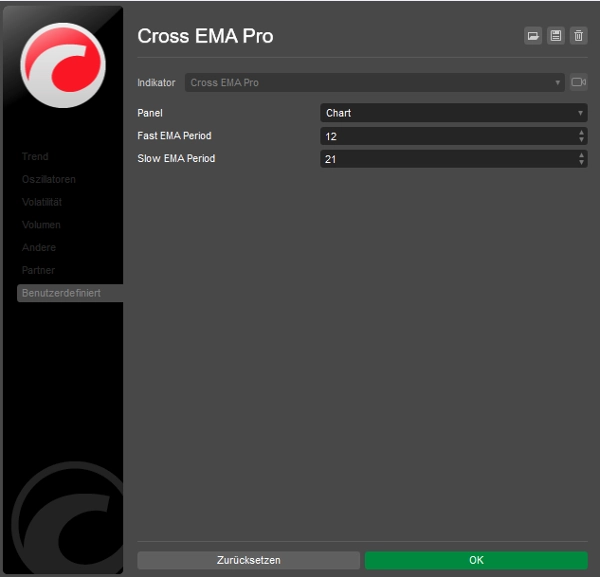
크로스 EMA Pro는 12기간과 21기간 EMA의 교차를 시각화하여 추세 반전을 정확하게 식별하는 데 도움을 줍니다. 색상 코딩으로 추세 방향을 빠르게 파악할 수 있습니다.
- 교차 신호: 12기간 및 21기간 EMA 기반
- 색상 구분: 상승 추세는 녹색, 하락 추세는 빨간색
- 유연한 사용: 스캘핑, 데이 트레이딩 및 장기 전략에 적합
요약
AI 요약
Cross EMA Pro is a trend reversal indicator that visualizes the crossover of 12-period and 21-period exponential moving averages (EMAs). It uses color coding—green for uptrends and red for downtrends—to help users quickly identify trend directions. The indicator provides clear crossover signals based on these two EMAs, making it suitable for various trading styles including scalping, day trading, and long-term strategies. It supports multiple markets such as Forex, stocks, indices, commodities, and cryptocurrencies including BTCUSD and XAUUSD. The indicator outputs visual signals on price charts to assist traders in recognizing potential trend reversals.
지표 프로필
지표 카테고리
추세
출력 유형
시각화
데이터 요구 사항
막대만
고객 리뷰
4.5
리뷰: 2
5 | 50 % | |
4 | 50 % | |
3 | 0 % | |
2 | 0 % | |
1 | 0 % |
고객 리뷰
September 22, 2024
September 22, 2024
No reason to yolo this live without a few normal sessions, and M15 is enough for the first pass.
상담
자주 묻는 질문(FAQ)
BTCUSD
Forex
Indices
Commodities
Crypto
Stocks
XAUUSD
트레이딩 봇, 지표, 플러그인 등 cTrader Store에서 제공되는 상품은 제3자 개발자에 의해 제공되며, 이는 단순히 정보 및 기술적 접근을 목적으로 제공된 것입니다. cTrader Store는 중개인이 아니며, 투자 조언, 개인별 추천 또는 향후 성과에 대한 어떠한 보장도 제공하지 않습니다.
이 작성자의 상품 더 보기


가격
가입일 11/09/2024
7
판매