
설명
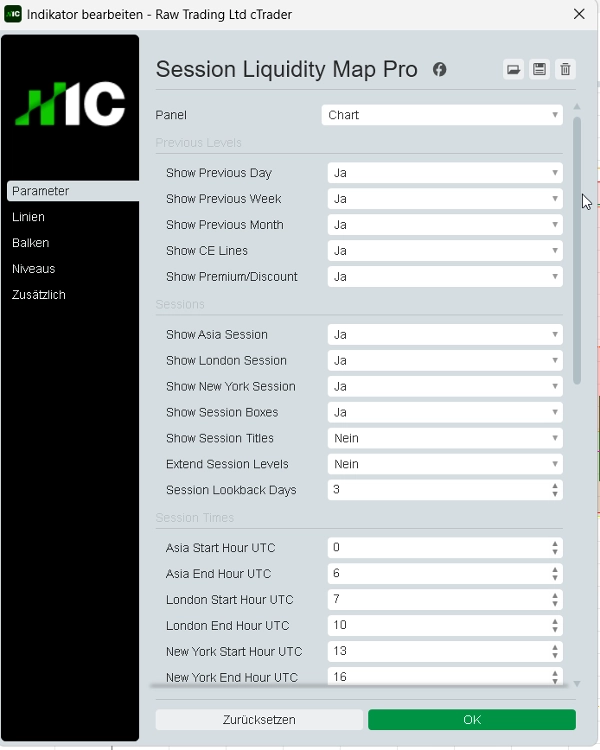
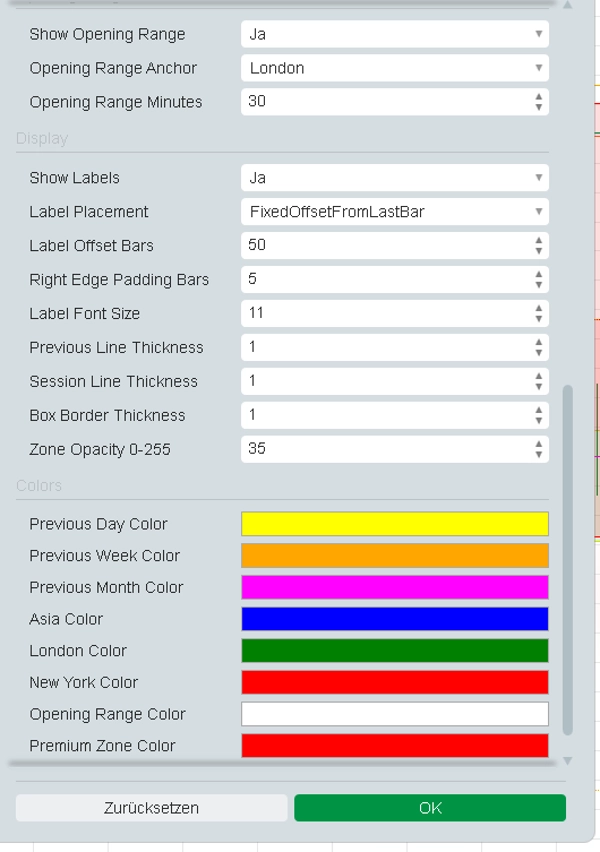
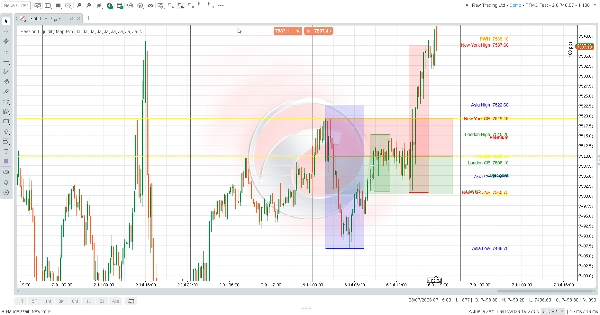
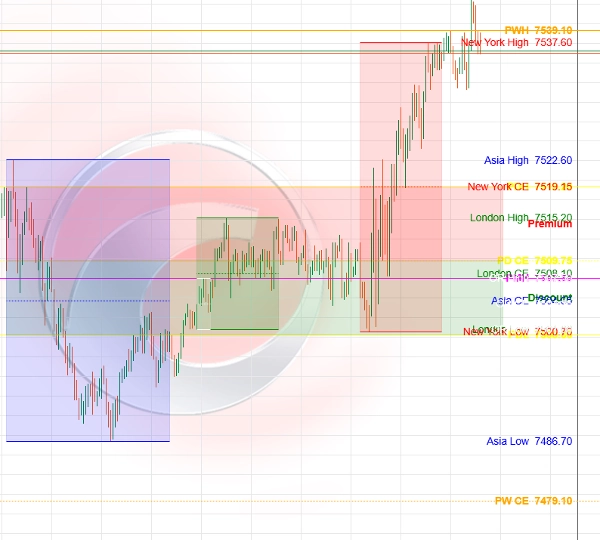
Session Liquidity Map Pro는 구조화된 가격 움직임 분석을 위한 시각적 cTrader 지표입니다. 이전 일, 주, 월의 고가/저가와 균형 수준, 아시아/런던/뉴욕 세션 범위, 개장 범위 수준 및 프리미엄/할인 구역을 자동으로 표시합니다.
이 지표는 차트 준비, 유동성 기반 분석, 시장 구조 검토 및 백테스팅 연구를 위해 설계되었습니다. 거래를 실행하지 않으며, 매수/매도 신호를 제공하지 않고, 전체 액세스 권한이 필요하지 않습니다.
거래에는 위험이 따릅니다. 과거 실적이 미래 결과를 보장하지 않습니다.
요약
AI summary
Session Liquidity Map Pro is a visual indicator for the cTrader platform designed to enhance structured price action analysis. It automatically maps key market data on your chart, including previous day, week, and month highs and lows, equilibrium levels, and session ranges for Asia, London, and New York. The indicator also highlights opening range levels and premium/discount zones, aiding in liquidity-based analysis and market structure review.
This tool supports chart preparation and backtesting research by visually presenting critical price levels and zones relevant to market participants. It does not execute trades or provide buy/sell signals and operates without requiring full access permissions. The indicator is categorized under market structure and provides visual outputs to assist traders in identifying liquidity sweeps, market structure shifts, key levels, and premium/discount areas.
Session Liquidity Map Pro is suitable for traders focusing on market structure concepts and price action analysis, offering a comprehensive overview of session dynamics and historical price points to inform trading decisions.
This tool supports chart preparation and backtesting research by visually presenting critical price levels and zones relevant to market participants. It does not execute trades or provide buy/sell signals and operates without requiring full access permissions. The indicator is categorized under market structure and provides visual outputs to assist traders in identifying liquidity sweeps, market structure shifts, key levels, and premium/discount areas.
Session Liquidity Map Pro is suitable for traders focusing on market structure concepts and price action analysis, offering a comprehensive overview of session dynamics and historical price points to inform trading decisions.
지표 프로필
지표 카테고리
시장 구조 (SMC)
출력 유형
시각화
데이터 요구 사항
막대만
지원되는 신호
반전
돌파
추세 강도
레벨 터치
레벨 돌파
시가 범위
고객 리뷰
0.0
리뷰: 0
고객 리뷰
이 상품에 대한 리뷰가 아직 없습니다. 이미 사용해 보셨나요? 다른 사람들에게 가장 먼저 소개해 주세요!
상담
자주 묻는 질문(FAQ)
Premium/Discount
Supertrend
Key Levels
MSS
Liquidity Sweep
Market Structure
트레이딩 봇, 지표, 플러그인 등 cTrader Store에서 제공되는 상품은 제3자 개발자에 의해 제공되며, 이는 단순히 정보 및 기술적 접근을 목적으로 제공된 것입니다. cTrader Store는 중개인이 아니며, 투자 조언, 개인별 추천 또는 향후 성과에 대한 어떠한 보장도 제공하지 않습니다.