
설명
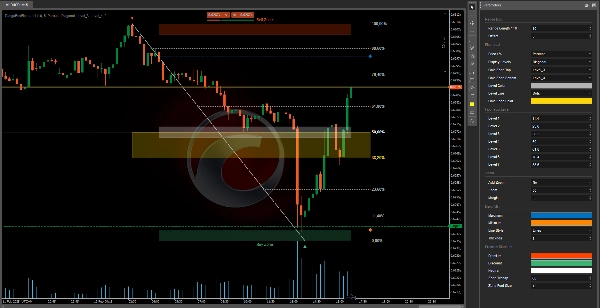
이 피보나치 되돌림 지표는 트레이더가 주요 되돌림 수준을 시각화하고 사용자 정의하여 시장에서 잠재적인 매수 및 매도 구역을 식별할 수 있도록 합니다.
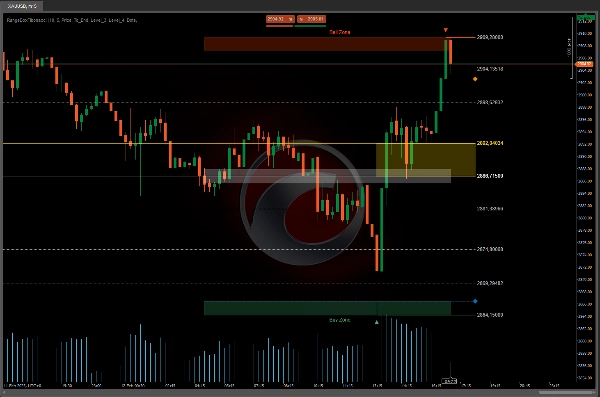
색상으로 표시된 "매도 구역"과 "매수 구역" 외에도 사용자는 피보나치 수준을 원하는 대로 조정할 수 있습니다.
이 지표는 보다 완전한 거래 경험을 위해 별도의 알림 지표와 함께 제공됩니다.
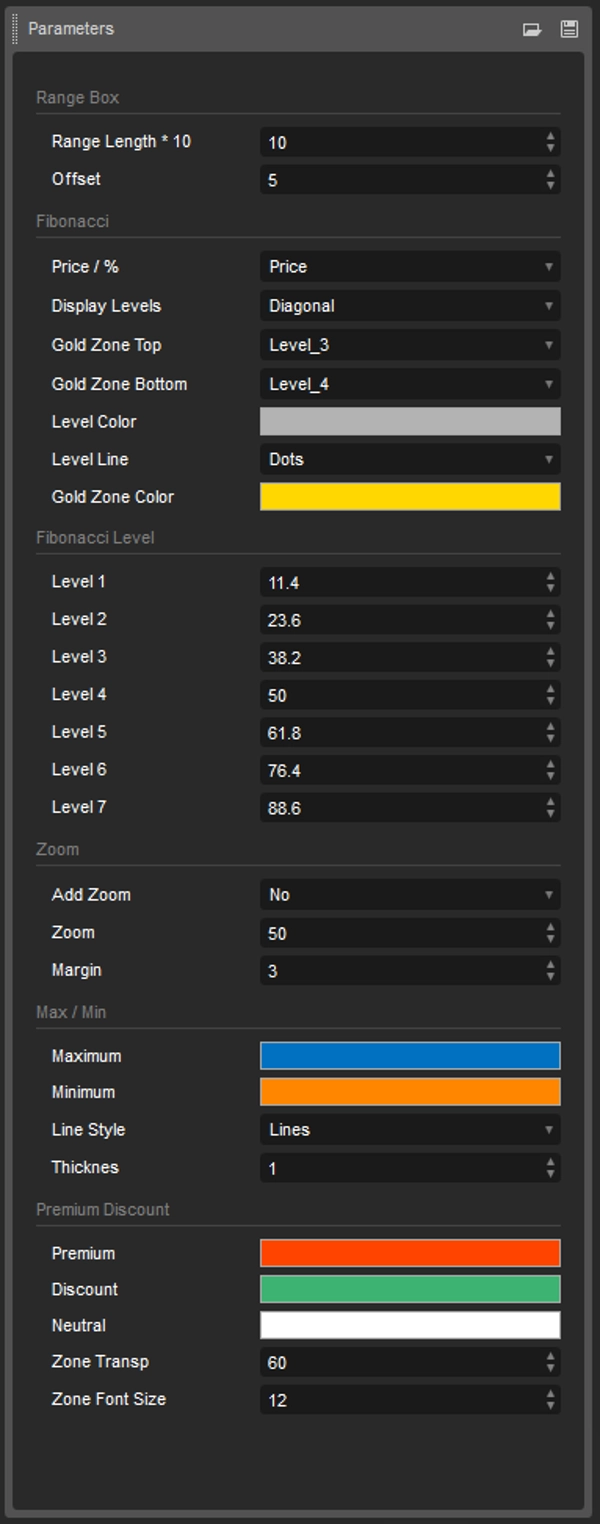
이 피보나치 되돌림 지표를 사용하면 트레이더는 차트에 표시되는 되돌림 수준을 완전히 제어할 수 있습니다.
피보나치 수준 사용자 정의 기능과 색상 구역 및 별도의 알림 지표를 통해 사용자는 도구를 개별 거래 전략에 맞게 조정할 수 있습니다.
다음과 같은 도구를 포함하면:
- OrderPrice V3 https://ctrader.com/products/397
- NTMPICLL https://ctrader.com/products/327
- MACDVolume https://ctrader.com/products/267
- MarketSession-MX https://ctrader.com/products/525
큰 손실을 볼 가능성은 없습니다.
요약
AI 요약
RangeBoxFibonacci is a customizable Fibonacci retracement indicator designed for traders to identify potential buy and sell zones across various markets including Forex, commodities, and indices such as EURUSD, GBPUSD, NZDUSD, XAUUSD (gold), and NAS100. The indicator displays key Fibonacci retracement levels on the chart, which users can adjust to fit their trading strategies. It highlights colored zones labeled "Sell Zone" and "Buy Zone" to visually assist in market analysis. Additionally, it is complemented by a separate alerts indicator to notify users of relevant market conditions. The tool supports integration with other trading aids like OrderPrice V3, NTMPICLL, MACDVolume, and MarketSession-MX, enhancing its functionality. This indicator provides traders with full control over displayed retracement levels, enabling tailored technical analysis for improved decision-making.
지표 프로필
고객 리뷰
4.5
리뷰: 2
5 | 50 % | |
4 | 50 % | |
3 | 0 % | |
2 | 0 % | |
1 | 0 % |
고객 리뷰
August 18, 2025
Displays Fibonacci zones in structured 9-level ranges. Lightweight and visually intuitive. Works on all timeframes. Cons: No alerts, tooltips, or preset saving. Needs confirmation tools to reduce subjectivity.
February 25, 2025
tested small first and that felt like the right move, and Bad settings can ruin the idea.
상담
자주 묻는 질문(FAQ)
Forex
EURUSD
Commodities
GBPUSD
NZDUSD
XAUUSD
NAS100
트레이딩 봇, 지표, 플러그인 등 cTrader Store에서 제공되는 상품은 제3자 개발자에 의해 제공되며, 이는 단순히 정보 및 기술적 접근을 목적으로 제공된 것입니다. cTrader Store는 중개인이 아니며, 투자 조언, 개인별 추천 또는 향후 성과에 대한 어떠한 보장도 제공하지 않습니다.
이 작성자의 상품 더 보기


좋아하실 만한 다른 항목


가격
147
판매
11.17K
무료 설치