
Descrição
Indicador Multi-Temporal Quantitative Qualitative Estimation (QQE)
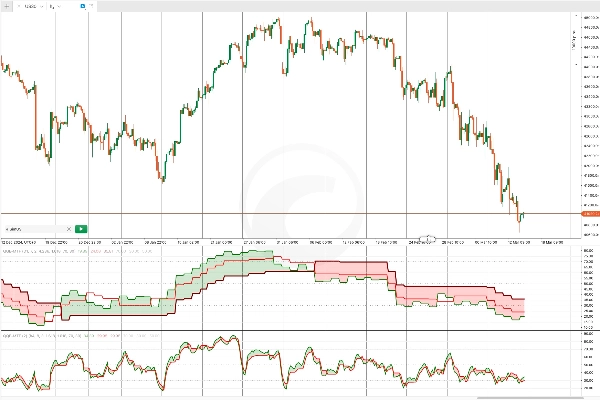
O indicador Quantitative Qualitative Estimation (QQE) é uma ferramenta de análise técnica que aprimora o Índice de Força Relativa (RSI) incorporando médias móveis suavizadas. Ele ajuda os traders a avaliar a força da tendência, potenciais reversões e condições de sobrecompra/sobrevenda com maior precisão.
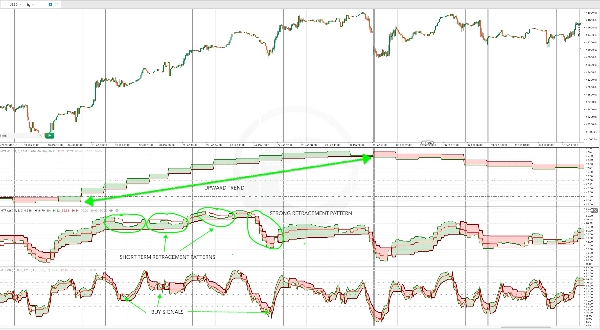
O QQE possui dois componentes principais: os níveis de stop trailing rápido e lento, que atuam como suporte e resistência dinâmicos. Isso o torna uma ferramenta versátil tanto para estratégias de seguimento de tendência quanto de reversão à média. Um cruzamento entre a linha QQE e sua linha de sinal frequentemente indica potenciais oportunidades de compra ou venda.
QQE Multi-Temporal: Uma Versão Avançada
Esta versão aprimorada do indicador QQE é projetada como uma ferramenta multi-temporal, integrando tanto linhas de tendência rápidas quanto lentas para maior precisão. Ao analisar a ação do preço em múltiplos períodos, oferece uma visão abrangente das tendências do mercado.
Seu algoritmo avançado de suavização aumenta sua confiabilidade, tornando-o um indicador eficaz e independente para:
✅ Identificar a direção da tendência
✅ Gerar sinais precisos de entrada e saída
✅ Detectar condições de sobrecompra e sobrevenda
A flexibilidade do QQE Multi-Temporal o torna adequado tanto para estratégias de seguimento de tendência quanto de reversão.
Como Usar o QQE Multi-Temporal
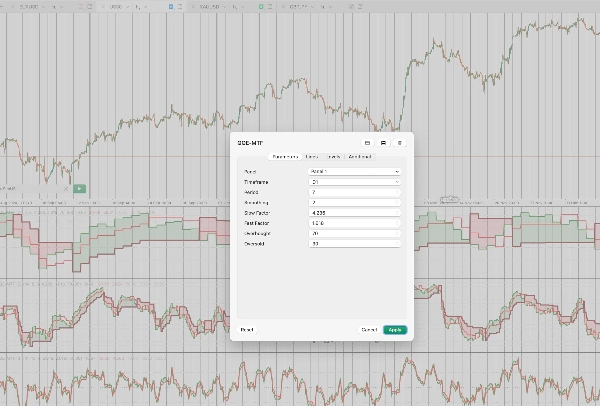
Para configurar o QQE Multi-Temporal, os traders devem selecionar:
🔹 Um período de tempo (ex.: Diário, H4, H1)
🔹 Períodos (número de velas usadas no cálculo)
🔹 Um período de suavização (para suavização do RSI)
🔹 Fatores lento e rápido (para ajustar a sensibilidade)
🔹 Níveis personalizáveis de sobrecompra e sobrevenda
📌 Nota: Como este é um indicador multi-temporal, após adicioná-lo ao gráfico, é essencial dar zoom out na interface do cTrader para permitir que dados suficientes sejam carregados e o indicador seja inicializado corretamente.
Estratégias de Negociação com o QQE Multi-Temporal
1️⃣ QQE para Confirmação de Tendência em Períodos Maiores
Uma forma eficaz de usar o QQE Multi-Temporal é para confirmação de tendência em um período maior enquanto se identificam entradas em retrações em um período menor.
Por exemplo:
- O QQE no período diário é usado para confirmar uma tendência forte.
- Entradas em retração são então identificadas quando o Oscilador Estocástico cruza os níveis de sobrecompra ou sobrevenda.
Este método ajuda os traders a alinhar suas entradas com a tendência geral.
2️⃣ Análise Multi-Temporal para Insights Mais Profundos do Mercado
Usar o QQE em múltiplos períodos permite que os traders obtenham uma compreensão mais detalhada do comportamento de um ativo.
Por exemplo, aplicando o QQE em:
📊 Período diário (D1): Determina a direção geral da tendência.
📊 Período de 4 horas (H4): Confirma a direção da tendência e identifica pullbacks de curto prazo.
📊 Período de 1 hora (H1): Gera sinais precisos de entrada baseados em condições de sobrecompra/sobrevenda ou movimentos contra a tendência.
Esta abordagem estruturada aprimora o timing das negociações e a tomada de decisões ao alinhar sinais entre diferentes períodos.
Resumo
This advanced multi-timeframe tool integrates fast and slow trend lines to analyze price action across different timeframes, providing a comprehensive view of market trends. Its smoothing algorithm improves reliability, making it effective for identifying trend direction, generating precise entry and exit signals, and detecting overbought/oversold levels.
Users configure the indicator by selecting a timeframe (e.g., Daily, H4, H1), periods for calculation, smoothing period for RSI, sensitivity factors, and customizable overbought/oversold thresholds. It is recommended to zoom out in the cTrader interface after adding the indicator to allow sufficient data loading.
Typical strategies include using the QQE on higher timeframes for trend confirmation and on lower timeframes for entry timing, as well as multi-timeframe analysis to enhance trade timing and decision-making by aligning signals across timeframes.
Avaliações de clientes
5 | 50 % | |
4 | 50 % | |
3 | 0 % | |
2 | 0 % | |
1 | 0 % |


