
Trend Cycle
Indicator
179 downloads
Version 1.0, Nov 2025
Windows, Mac
Description
Trend Cycle is a trend analytics tool that focuses on trend duration, not just direction.
It:
- Detects bullish and bearish trends based on the slope of a Hull Moving Average (HMA).
- Counts how many bars the current trend has been active (Real Length).
- Stores the lengths of recent up-trends and down-trends separately.
- Computes the average length of bullish and bearish trends (Bull avg / Bear avg).
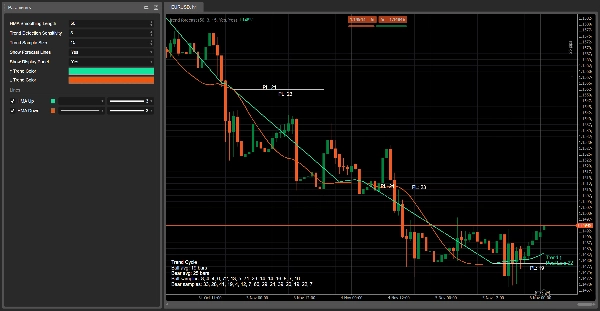
- Draws:
- A green HMA during bullish trends and red HMA during bearish trends.
- Horizontal projection lines at the start of each trend, with a label like
PL: 18(Probable Length in bars). - A live label near the current price showing trend direction and Real Length.
- A display panel with:
- average bullish and bearish trend duration,
- lists of recent trend lengths (up to the selected sample size).
The goal is to help you answer:
“How old is this trend, and how long do trends like this usually last?”
How it works (logic)
- Hull Moving Average (HMA)
The indicator calculates a Hull Moving Average of the close price using the HMA Smoothing Length parameter.
The HMA is smoother than a simple/EMA but responds quickly to direction changes. - Trend detection by slope
Over the last Trend Detection Sensitivity bars, it checks the HMA:
As long as a trend is defined, a counter (Real Len) is increased each bar, representing the duration of the current trend. - If HMA has been strictly rising → trend is bullish (↑).
- If HMA has been strictly falling → trend is bearish (↓).
- Otherwise, it keeps the previous trend state.
- Recording trend lengths
When the trend flips from bullish to bearish or vice-versa: - The duration of the completed trend is stored:
- bullish trends into the bullish list,
- bearish trends into the bearish list.
- Each list is limited by Trend Sample Size (e.g. last 10 trends).
- These samples are used to compute:
- Bull avg = average bullish trend length.
- Bear avg = average bearish trend length.
- Probable Length projections
At the start of each new trend, if there are enough samples:
These projections are kept on the chart as history so you can visually compare predicted vs actual trend durations. - It calculates the average length for that trend type (bullish or bearish).
- Draws a horizontal line from the trend start bar for approximately that many bars.
- Places a label at the centre of the line:
PL: X→ Probable Length = X bars.
- Live label
On every bar, the indicator draws a single live label near the HMA:
This shows current trend direction and exactly how many bars it has lasted so far. - Example text:
Trend ↑Real Len: 7
- Colour:
- Green (↑) for bullish trends
- Orange/red (↓) for bearish trends
- Display panel (bottom left)
When Show Display Panel is enabled, a static text panel appears in the corner of the chart showing:
This acts as a quick statistical overview of recent trend behaviour on that symbol/timeframe. - Title: Trend Cycle
Bull avg: X barsBear avg: Y barsBull samples:list of recent bullish trend lengthsBear samples:list of recent bearish trend lengths
How to read it in practice
- Green HMA + “Trend ↑”
→ A bullish trend is active.
→Real Lentells you how many bars it has lasted so far.
→ The most recentPL: Xline gives you a visual idea of how long similar bullish trends tend to run. - Red HMA + “Trend ↓”
→ A bearish trend is active.
→Real Len= age of the current downtrend.
→ Compare Real Len vsBear avgin the panel to see if the move is young or mature. - When Real Len approaches or exceeds the average (Bull avg / Bear avg):
→ The current trend is statistically “old” compared to recent history.
→ You may choose to: - tighten stops,
- lock in profits,
- be more cautious with fresh entries in that direction.
- Short trends vs long trends
- Many very short trends → choppy / mean-reverting environment.
- Few long trends → more directional market, with extended moves.
Summary
AI summary
Trend Cycle is a technical indicator designed to analyze trend duration in financial markets. It detects bullish and bearish trends by evaluating the slope of a Hull Moving Average (HMA) applied to closing prices, providing a smoother yet responsive measure of trend direction. The indicator counts the number of bars the current trend has been active (Real Length) and records the lengths of recent up-trends and down-trends separately. Using these samples, it calculates average durations for bullish and bearish trends.
Visual elements include a green HMA line during bullish trends and a red HMA line during bearish trends. Horizontal projection lines mark the probable length of each trend at its start, labeled with "PL: X" to indicate expected duration in bars. A live label near the current price displays the active trend direction and its age in bars. An optional display panel offers a summary of average trend durations and recent trend length samples.
Trend Cycle helps users assess how long the current trend has lasted relative to historical trends, aiding decisions such as adjusting stops or managing entries. It supports analysis across various markets including Forex, cryptocurrencies, indices, commodities, and stocks.
Indicator profile
Customer reviews
0.0
Reviews: 0
Customer reviews
No reviews for this product yet. Already tried it? Be the first to tell others!
Discussion
FAQ
BTCUSD
Forex
Signal
Breakout
Indices
EURUSD
Commodities
GBPUSD
NZDUSD
Martingale
Bollinger
Prop
ZigZag
Scalping
Supertrend
Crypto
Grid
Stocks
AI
XAUUSD
NAS100
USDJPY
Products available through cTrader Store, including trading bots, indicators and plugins, are provided by third-party developers and made available for informational and technical access purposes only. cTrader Store is not a broker and does not provide investment advice, personal recommendations or any guarantee of future performance.


Price
42.11M
Traded volume
6.13M
Pips won
227
Sales
8.46K
Free installs