Brokers & props
For business
00
Days
:
00
Hours
:
00
Minutes
:
00
Seconds
Indicator
NAS100
NZDUSD
Martingale
Forex
Fibonacci
EURUSD
MACD
BTCUSD
SMC
Indices
ATR
Stocks
Grid
RSI
Breakout
XAUUSD
FVG
Commodities
Signal
Bollinger
GBPUSD
AI
VWAP
ZigZag
Prop
Supertrend
Crypto
USDJPY
Scalping
Volume Bubble
4.0
10/12/2025
158
Desktop
Since 04/03/2025
Traded volume
35.72M
Pips won
5.97M
Sales
37
Free installs
2162
"Volume Bubble" uploaded image"Volume Bubble" uploaded image

Volume Bubbles – cTrader Custom Indicator

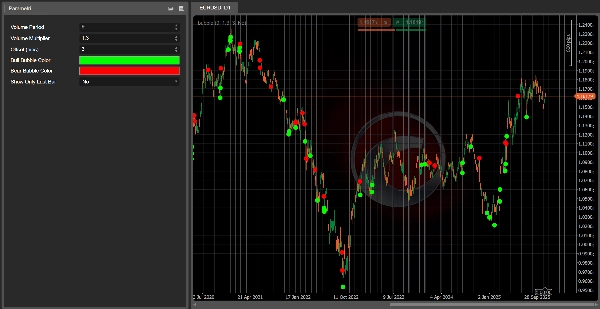
Volume Bubbles is a lightweight yet powerful visual indicator for cTrader that highlights candles with exceptional volume directly on the price chart.

Instead of staring at the volume histogram and trying to guess which bars truly matter, this tool automatically detects when the current candle’s volume is significantly higher than the recent average and draws a bubble (circle icon) on that bar:

  • For bullish candles, a bubble is drawn below the low of the candle.
  • For bearish candles, a bubble is drawn above the high of the candle.


This makes it extremely easy to spot potential climactic moves, areas of strong interest from large players, or possible exhaustion points in the trend.

Key Features

  • ✅ Detects high-volume candles using a Moving Average of tick volume
  • ✅ Draws clear bubbles on the chart (no extra subwindow needed)
  • ✅ Different colors for bullish and bearish volume spikes
  • ✅ Adjustable offset in pips to position bubbles away from the candle
  • ✅ Option to show bubbles only on the latest bar (for real-time trading)


Inputs / Parameters

  • Volume Period – Number of bars used for the volume moving average.
  • Volume Multiplier – How many times above the average volume a bar must be to trigger a bubble.
  • Offset (pips) – Distance between the bubble and the candle high/low.
  • Bull Bubble Color – Color of bubbles on bullish candles.
  • Bear Bubble Color – Color of bubbles on bearish candles.
  • Show Only Last Bar – If true, displays bubbles only on the current live bar.


How to Use

Add Volume Bubbles to your chart and use it as a visual filter to:

  • Confirm breakouts backed by strong volume
  • Spot possible reversals or exhaustion candles
  • Identify zones where big players may be active

It’s not a standalone trading system, but it’s an excellent companion tool to any price action or trend-following strategy that cares about volume.


👉 Join here: Algotrendit Volume Bubbles

Inside the server you’ll find:

  • Support for this and other cBots/indicators
  • Strategy discussion and optimization ideas
  • Updates, news, and future tools I release


4.0
Reviews: 1
5
0 %
4
100 %
3
0 %
2
0 %
1
0 %
Customer reviews
November 24, 2025
Volume Bubble highlights candles with significantly high volume by drawing bubbles right on the price chart - simple, clever, and efficient. Great for spotting potential climactic moves, blow-offs, or breakout confirmation without diving into separate volume windows. Just remember: context matters. Alerts and built-in stats would make it even better.
More from this author
Indicator
NAS100
NZDUSD
Martingale
+26
Volume Delta
Read aggressive flow in real time. Flexible resets (Day/Week/Month), optional EMA smoothing, and non-repainting cumulati
cBot
NAS100
NZDUSD
Martingale
+26
ElliottWave Pro cBot
The Elliott Wave Pro Bot is a sophisticated and highly configurable algorithmic trading system
cBot
NAS100
NZDUSD
Martingale
+26
ElliottWaveBot
N.B.: Results with an initial invested capital of 100 euros.
cBot
NAS100
NZDUSD
Martingale
+26
Prop Ready Bot_v.2.0
The Prop-Ready Bot The Definitive Automaton for Challenges 🛡️ V2.0
Indicator
Grid
NZDUSD
XAUUSD
+16
vWAP Free
Editions: Free (core VWAP + bands) · Pro (multi‑VWAP, click‑to‑anchor, alerts).
cBot
NAS100
NZDUSD
Martingale
+26
Dynamic Trendline Deluxe Pro Cbot - PROP edition
Major Update Announcement: Advanced Prop Firm Risk Management is Here! 🚀
Indicator
NAS100
NZDUSD
Martingale
+26
Breakout channel
Breakout Channels automatically detects consolidation ranges and highlights when price breaks out of them.
cBot
Indices
RSI
Forex
+2
US 2000+MACD+ADR+ADMIR+RSI+MANY MORE-TF4M
N.B.: Results with an initial invested capital of 100 euros.
Indicator
NAS100
NZDUSD
Breakout
+14
ZIG ZAG Free
ZigZag Free is a clean swing-detection tool that marks significant pivot highs/lows
cBot
Grid
NAS100
RSI
+20
Breakout Premium Pro v2.0
A price-action-first algorithm to trade Breakout, Approach, and Return around prior High/Low levels—with Prop-style risk
Indicator
Grid
NAS100
NZDUSD
+15
EMA UP&DOWN 2025
SectorIndex Dual Moving Average Indicator: Your Market Compass 🧭
cBot
Indices
ATR
US500 LONG&SHORT TF 5M ALL SEASON!
🚀N.B.: Results with an initial invested capital of 100 euros.
Indicator
NAS100
NZDUSD
Martingale
+25
Volume Profile Suite trial7D
DEMO VERSION 7 DAYS VolumeProfileSuite is an advanced and flexible Volume Profile indicator for cTrader.
Indicator
ZigZag
Indices
Breakout
+1
Auto Tools Suite
Auto Trendlines, Fibonacci, Pitchfork and Patterns from non‑repainting pivots. One‑click Presets, targeted Alerts, and a
cBot
RSI
BASIC us500 SHORT 35%
N.B.: Results with an initial invested capital of 100 euros.
Indicator
NAS100
Breakout
XAUUSD
+14
Initial Range
Initial Range – Where the open writes the script.
Indicator
NAS100
NZDUSD
Martingale
+26
Pattern Scanner
Patter Scanner all Chart Let your chart tell you when patterns appear
cBot
Breakout
ATR
Signal
EMA Up&Down 2025 Ctrader bot
✨ N.B.: Results with an initial invested capital of 100 euros.📈
You may also like
Indicator
Indices
RSI
Commodities
+1
OrderPrice-V3
A straightforward yet effective tool signals entry points for both buying and selling. Include 3 Moving Average
Indicator
Indices
XAUUSD
Forex
+3
Three Candle Patterns
Spot powerful 3-candle reversal patterns like Morning/Evening Star and Soldiers/Crows at key swing highs and lows
Indicator
NAS100
Indices
XAUUSD
+9
HAIQuantum_TheGameV2
This trading game allows you to explore and practice investment strategies in a real-time market data environment.
Indicator
NAS100
NZDUSD
Breakout
+12
Supertrend - Multi-Timeframe
Supertrend - Multi-Timeframe Indicator
Indicator
RSI
Breakout
XAUUSD
+5
Zones Supply Demand
📊Zones Supply & Demand: Identifies key price levels with high volume concentration, marking Supply/Demand Zones & Marke
Breakout Mode Patterns
Brooks price action breakout mode patterns
Indicator
Indices
Commodities
Forex
+1
HTF Candle
HTF Candle
Indicator
ZigZag
VWAP
FVG
+4
Candle Volume Profile Demo
Candle Volume Profile for Crypto
Indicator
Stocks
Forex
Crypto
Trend Angle Indicator [Iridio Capital]
The Trend Angle Indicator provides a clear and intuitive way to visualize market trends.
Indicator
NAS100
NZDUSD
XAUUSD
+10
Candle Count
Label each candle sequentially with flexible session resets.
Indicator
NAS100
NZDUSD
Martingale
+22
Zigzag Trend
The ZigZag Trend is a market structure tool that filters out small price fluctuations and highlights major swing.
IR Ichimoku Macd
this indicaotr show distance between Tenkan to Kijun, Close to Kijun and Close to Tenkan 
Indicator
XAUUSD
Commodities
Forex
+5
BullBear Dynamics
BullBear Dynamics helps traders detect and interpret the balance between bullish and bearish momentum
Market BIAS Detector
The Market BIAS Detector is a smart trading assistant designed to identify the market.
Indicator
Indices
Breakout
Commodities
+3
Daily Levels
The "Daily Levels" indicator is used to display last week's and yestoday high/low price
ZigZag Price Liquidity Projection
📊 ZigZag Liquidity Projection: Predict bounces/breaks using pivots, ATR & volume.
Indicator
Signal
Scalping
[Stellar Strategies] Linear Regression Candles 1.1
Approach to price analysis by visualizing candlestick data through the lens of linear regression slopes 📈📉
Indicator
NAS100
NZDUSD
Breakout
+17
Deviation Indicator by PrimeQuant
True Deviation - Trade extremes and reversions with deviation channels, SMC swings, liquidity levels, and impulse bias.