
Order Flow Ticks v2.0
Indicator
12.1K downloads
Version 1.1, Jan 2026
Windows, Mac
4.4
Reviews: 23
Description
Last Description -> 11/11/2025
Every aspect of Order Flow Ticks (Aggregated version) was carefully designed with performance in mind, so it can run even in lower-end machines.
Still, here some "Tips and Tricks" for better usage:
- Tick data are stored in RAM, even though cTrader already have good memory management:
- Load just what's really needed for live trading.
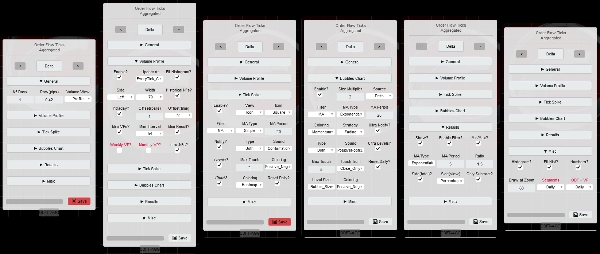
- Params Panel already shows which parameters are supported by each mode.
- Segments Interval may change the filters analysis, use Daily interval for Intraday momentum.
- At Higher Timeframes (Price-Based Charts included)
- Set ODF + VP to Weekly
- Nº days / Reset Daily? parameters is now Week/Weekly.
- All filters will be reset every Week instead of each Day.
- "Lower Timeframe" with "Small Row Size":
- Custom MAs are made to speed up the recalculate when switching settings at Params Panel.
- If you want to stick with cTrader Moving Averages, set [ODF] Use Custom MAs? to False
- Have patience if any Filter [Results / Spike / Bubbles] is activated.
- If High-Performance is needed:
- Disable Volume Profile and/or use Mini-VPs instead. (default)
- Use "Concurrent" on "[VP] Update Strategy" at "Specific Settings", there's a RAM usage cost, though. (default)
- Use "Redraw_Fastest" on "Performance Drawing" settings (default)
- Use Custom MAs (default)
- Any filled and/or Text drawings are quite heavy when there are many of them.
- When back-testing, some drawings on Price-Based Charts are broken, but works fine in real-time.
- Saved Settings are stored at "Documents/cAlgo/LocalStorage/ODFT-AGG ..."
New analysis features of Order Flow Ticks:
- Tick Spike Filter
- Moving Average or Standard Deviation.
- as Icon or Bubbles.
- Spike Levels.
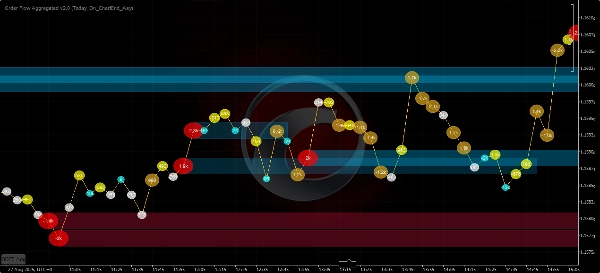
- Spike Chart (Bubbles):
- Heatmap Coloring.
- Positive/Negative Coloring.
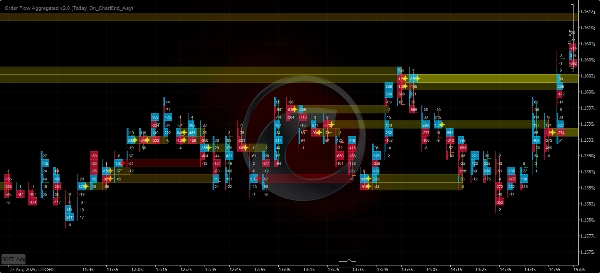
- Bubbles Chart
- Moving Averages, Standard Deviation, or both.
- [Volume Delta / Cumulative Delta Change / Subtract Delta] as source.
- Ultra Bubbles Levels.
- Heatmap Coloring.
- Momentum Coloring:
- Fading
- Positive/Negative
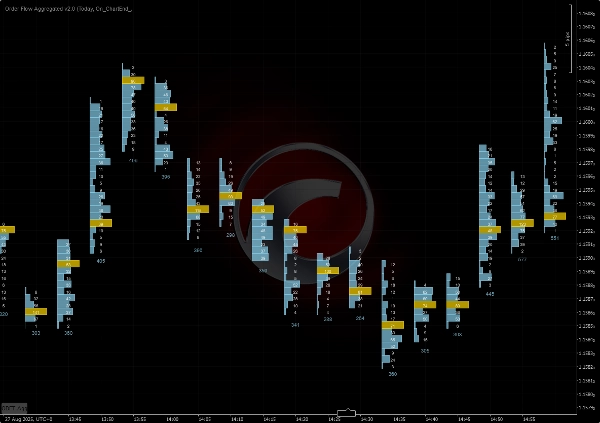
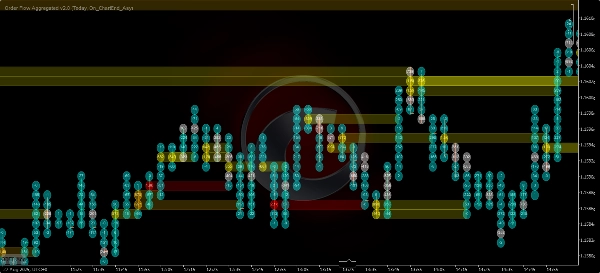
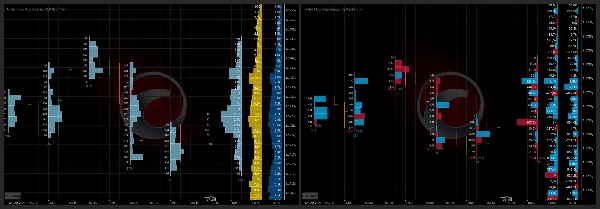
- Volume Profile
- Mini-VPs - From 5 minutes to 1 day.
- Daily, Weekly, Monthly Profiles!
- Fixed Range Profiles.
=============================
Always prefer the cTrader's Store version, it's updated first.
All the indicators I've developed are open source. If you don't have access to the code, check out the Github repository
Summary
AI summary
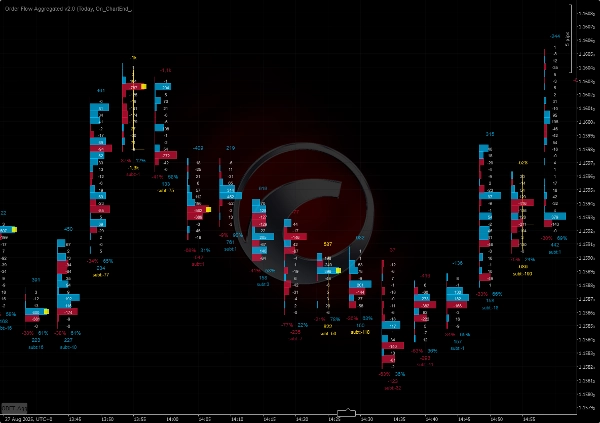
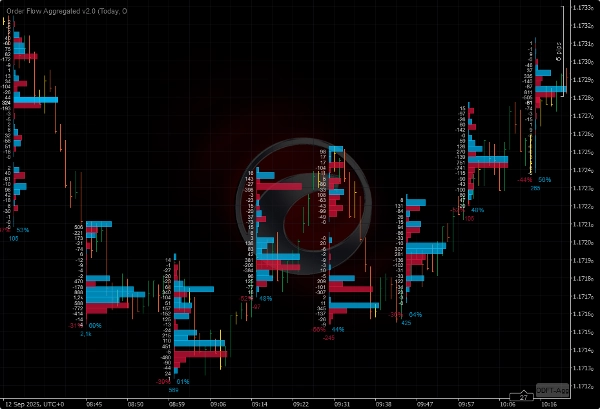
Order Flow Ticks v2.0 is an open-source indicator for the cTrader platform that adapts traditional Order Flow (Footprint) concepts to tick volume data. It supports multiple chart types including ticks, Renko, and range charts. The indicator offers several visualization modes: Normal Mode (volume profile per bar), Buy vs Sell Divided Mode (bid/ask footprint), Buy vs Sell Profile Mode, Delta Divided Mode (delta footprint), and Delta Profile Mode.
Version 2.0 introduces a parameters panel for quick switching between settings such as volume modes and row height, and it uses the Colors API exclusively. It is compatible with Mac OS and requires .NET 6.0 or higher.
Key features include:
- Tick Spike Filter with moving average or standard deviation, displayed as icons or bubbles with heatmap and positive/negative coloring.
- Bubbles Chart showing volume delta, cumulative delta change, or subtract delta with momentum coloring and ultra bubble levels.
- Volume Profile options including mini-profiles from 5 minutes to 1 day, daily, weekly, monthly, and fixed range profiles.
The indicator is optimized for performance to run efficiently on lower-end machines. It stores tick data in RAM and offers settings to balance performance and detail, including custom moving averages and concurrent update strategies. Saved settings are stored locally.
Indicator profile
Customer reviews
4.4
Reviews: 23
5 | 74 % | |
4 | 13 % | |
3 | 4 % | |
2 | 0 % | |
1 | 9 % |
Customer reviews
May 13, 2026
Just a note to say thank you to the creator for making this free of charge. Appreciate it.
March 23, 2026
It's great, Thank you! Can you pls make an update, it doesnt work fully on Indices on CFD
March 9, 2026
"Thank you very much for your work on Order Flow Tick 2.0. It is truly excellent and unique."
October 22, 2025
this is great, i just can't see all the options because the panel is cut short. i don't have access to the bubbles and other features that are apparently there in the code
September 27, 2025
August 3, 2025
Amazing indicator! Once you learn how to use it it really helps out so much, love it!
July 9, 2025
Pros: Real-time tick flow visualization with buy/sell separation. Helps assess market activity and hidden liquidity. Easy to set up, works stable on major assets. Cons: No alerts on tick spikes. No history or tooltips. Requires experience to interpret data correctly.
July 3, 2025
June 20, 2025
Great indicator. It takes a bit of work to learn how to use it properly. Not to be used in isolation, you need to plan potential reversal zones.
April 15, 2025
This looks promising! I tested it out manually, but I would love to automate it! How could we get the source code? :) Really, Pls.
Discussion
FAQ
VWAP
Products available through cTrader Store, including trading bots, indicators and plugins, are provided by third-party developers and made available for informational and technical access purposes only. cTrader Store is not a broker and does not provide investment advice, personal recommendations or any guarantee of future performance.


Price
Since 12/12/2024
1
Sales
33.27K
Free installs