
Weis & Wyckoff System v2.0
Indicator
2.58K downloads
Version 1.4, Sep 2026
Windows, Mac
5.0
Reviews: 3

Since 12/12/2024
2
Sales
37.23K
Free installs
Description
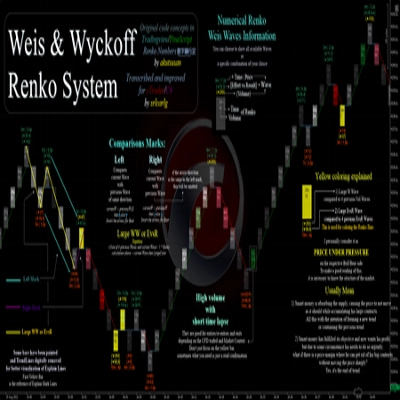
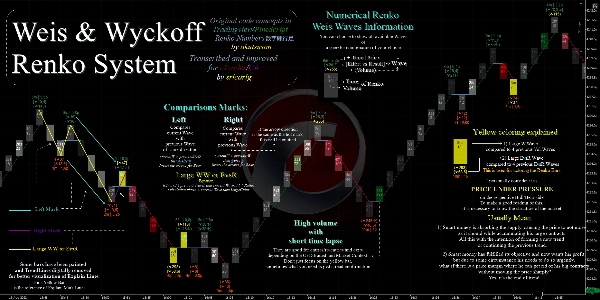
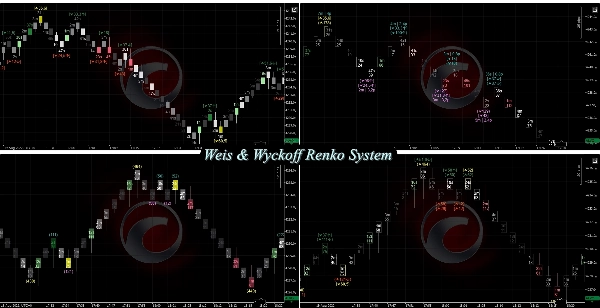
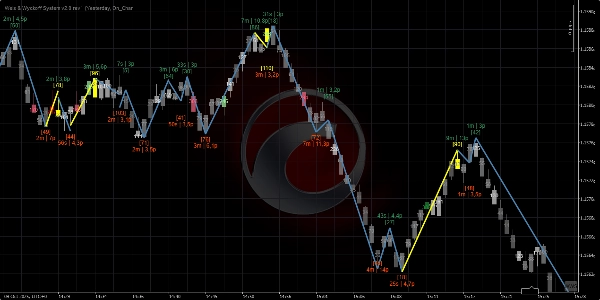
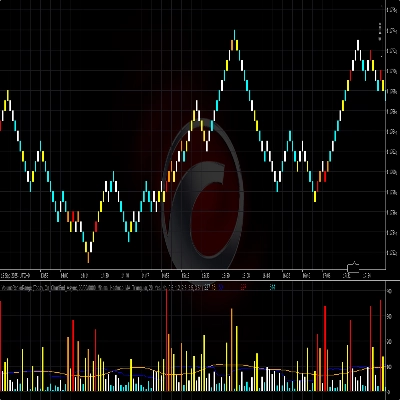
Weis & Wyckoff System now supports any chart! [Candles, Tick, Renko, Range, Heikin-Ash]
Last Description -> 11/11/2025
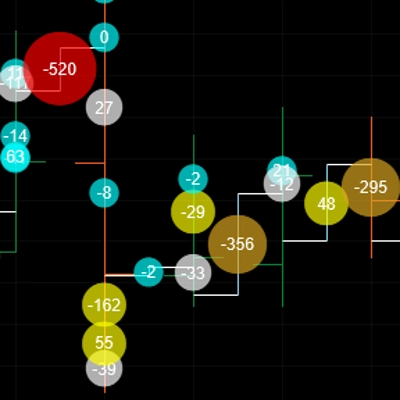
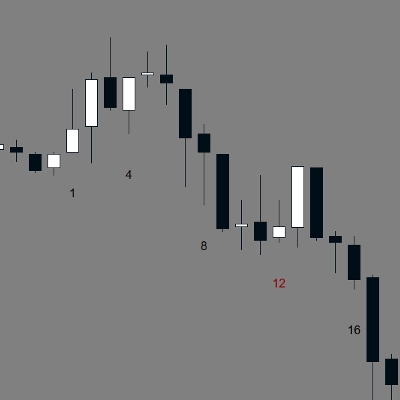
Weis & Wyckoff System showcases the concepts of David H. Weis and Richard Wyckoff
What's new in Revision 1?
- Support to [Candles, Heikin-Ash, Tick, Range] Charts
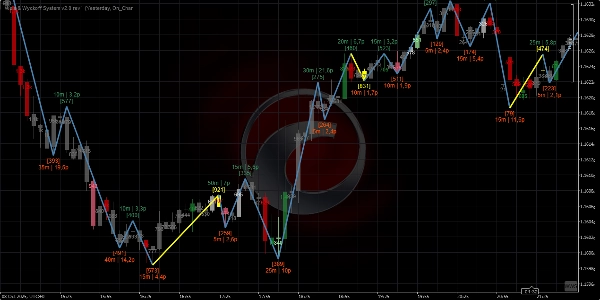
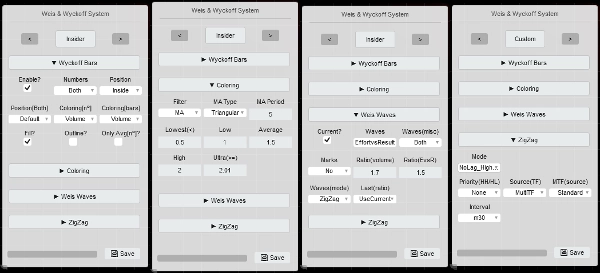
- Improved ZigZag => MTF support + [ATR, Percentage, Pips, NoLag_HighLow] Modes
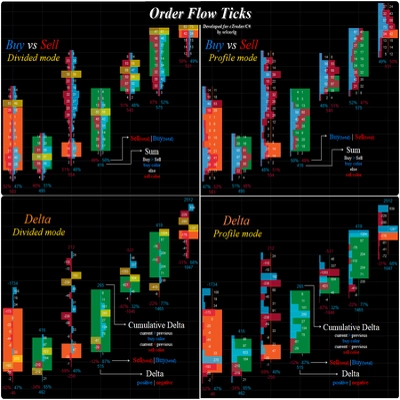
- Includes all "Order Flow Aggregated" related improvements
- Custom MAs
- Performance Drawing
- Strength Filters (MA/StdDev/Both)
- High-performance VP_Tick()
- High-performance GetWicks()
- Asynchronous Tick Data Collection
- Fix => Params-panel on MacOS
==========================
It's just a way of visualizing the Waves and Volume numerically, it's not an original idea.
You can find this way of visualization first at:
- David Weis on Wyckoff | Support/Resistance | and Waves,
- Weis on Wyckoff Renko Charts - Linda Raschke (most recent)
This uses the code concepts of:
- (Numbers-Renko 数字練行足 in PineScript),
- Cheers to the akutsusho!.
I improved it and brought it to cTrader/C# and it's also free/open-source.
=========================================
Transcribed & Improved for cTrader/C#
by srlcarlg
Original Code Concepts in TradingView/Pinescript
by akutsusho
=========================================
Always prefer the cTrader's Store version, it's updated first.
All the indicators I've developed are open source. If you don't have access to the code, check out the Github repository
Summary
AI summary
Weis & Wyckoff System v2.0 is an open-source trading indicator for the cTrader platform that visualizes market waves and volume based on the concepts of David H. Weis and Richard Wyckoff. It supports multiple chart types including Candles, Heikin-Ashi, Tick, Range, and Renko charts. The system numerically displays wave patterns and volume dynamics to assist in market analysis.
Key features include:
- A versatile Params Panel with four layout templates (Insider, Time, Volume, BigBrain) for quick and user-friendly customization.
- Enhanced ZigZag functionality with multi-timeframe support and multiple modes such as ATR, Percentage, Pips, and NoLag High/Low.
- Integration of order flow aggregation improvements, including custom moving averages, performance drawing, strength filters (MA, StdDev, or both), and high-performance tick volume and wick calculations.
- Dynamic TimeLapse feature showing time waves across various intervals from milliseconds to days.
- Compatibility with Mac OS and requires .NET 6.0 or higher.
The indicator is a C# adaptation and improvement of original PineScript concepts, designed to provide detailed wave and volume visualization without repainting options. It is maintained as open source, with code available on GitHub for transparency and further development.
Key features include:
- A versatile Params Panel with four layout templates (Insider, Time, Volume, BigBrain) for quick and user-friendly customization.
- Enhanced ZigZag functionality with multi-timeframe support and multiple modes such as ATR, Percentage, Pips, and NoLag High/Low.
- Integration of order flow aggregation improvements, including custom moving averages, performance drawing, strength filters (MA, StdDev, or both), and high-performance tick volume and wick calculations.
- Dynamic TimeLapse feature showing time waves across various intervals from milliseconds to days.
- Compatibility with Mac OS and requires .NET 6.0 or higher.
The indicator is a C# adaptation and improvement of original PineScript concepts, designed to provide detailed wave and volume visualization without repainting options. It is maintained as open source, with code available on GitHub for transparency and further development.
Indicator profile
Customer reviews
5.0
Reviews: 3
5 | 100 % | |
4 | 0 % | |
3 | 0 % | |
2 | 0 % | |
1 | 0 % |
Customer reviews
December 25, 2025
July 9, 2025
Pros: Visualizes wave structure and market phases using Renko and volume, following Wyckoff principles. Flexible settings, clear structure recognition. Cons: No tooltips or alerts. Requires Renko charts, less applicable on standard timeframes. Demands experience for interpretation.
May 13, 2025
its amazing indicator and thanks for coding this. Can you do this for range chart.
Discussion
FAQ
ZigZag
VWAP
Products available through cTrader Store, including trading bots, indicators and plugins, are provided by third-party developers and made available for informational and technical access purposes only. cTrader Store is not a broker and does not provide investment advice, personal recommendations or any guarantee of future performance.







!["Session Volume Profile (SVP) [Iridio Capital]" logo](https://cdn.ctrader.com/image/webp/b058beb7-b143-45f3-87d0-8c524c00b203_61552)






Price
Since 12/12/2024
2
Sales
37.23K
Free installs