
Description
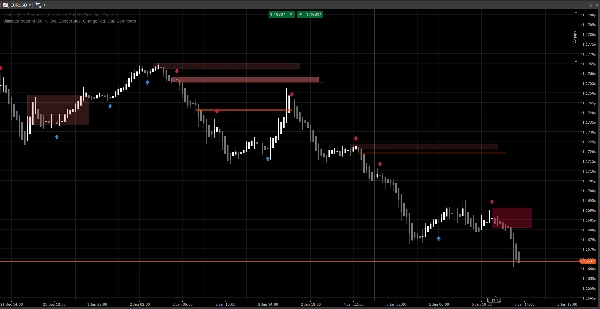
A clean market structure system that displays price gaps, order blocks, and breakout-based signals, with optional volume confirmation and retest alerts. Built for clarity on both standard charts and Renko.
This indicator focuses on readability and execution, not clutter. Zones are extended forward and automatically managed (expiration / invalidation), helping you track the levels that matter while price unfolds.
What it detects
Price Gaps (3-bar inefficiencies)
- Highlights bullish and bearish gaps directly on the chart
- Optional display (toggle on/off)
Order Blocks (last opposite candle before displacement)
- Bullish and bearish OB zones
- Automatically extended forward until invalidated / max extension reached
Structure Break Signals (Swing breakout logic)
- Breakout-based detection using swing highs/lows
- Prints signal arrows (up/down) when a new order block is confirmed
Real-time updates
- Designed to keep updating smoothly in live conditions
- Works on classic candles and behaves well on Renko-style price action
Smart filtering (optional)
Volume confirmation
- You can require a volume Z-score confirmation before validating an order block signal
- Adjustable baseline and sensitivity
Alerts (optional)
Enable alerts for:
- New order block detected
- Order block retest with direction (rejection candle)
How to use it (simple workflow)
- Use Price Gaps and Order Blocks as reaction zones (areas of interest).
- Let Signals highlight structure breaks and the corresponding OB formation.
- Use Retest alerts to catch returns into the zone with rejection behavior.
- Combine with your own entries/exits (risk management stays yours).
Inputs overview
Volume Logic
- Volume Baseline: smoothing period used for a Z-score calculations
- Volume Sensitivity: controls how strongly volume affects zone visibility
Price Gaps
- Show Price Gaps
- Bullish / Bearish Gap colors
Order Blocks
- Show OB
- Bullish / Bearish OB colors
- Max Extension: how far zones extend forward
Signals
- Show Arrows
- Swing Lookback: defines swing detection window
- Require Volume Confirmation (optional)
- Volume Threshold + Volume Period
- Signal Colors
- Zone Transparency
- Max Extension Bars (signals)
Alerts
- Enable Alerts
- Alert New OB
- Alert Retest
FAQ
1) Does it repaint?
No.
The indicator does not “move” historical signals to new locations after the bar is closed.
- Zones (Gaps / OB rectangles) are created from historical bars and then extended forward.
- Signals (arrows) are confirmed from closed bar conditions (swing break + OB selection).
Once an arrow is printed, it is not retroactively relocated.
Important nuance (normal behavior):
While the current bar is still forming, prices (High/Low/Close) can still change. This can cause:
- a zone to update its right-edge extension (visual extension),
- a retest condition to be temporarily true then false on the same forming bar.
That is not repainting—it’s real-time updating on an unfinished candle.
2) What’s the difference between “redraw” and “repaint” here?
Redraw = yes (by design).
Repaint = no.
- Redraw means rectangles are re-drawn/extended on the chart so the zone keeps projecting into the future. This is required for a live “footprint” style overlay.
- Repaint would mean the indicator changes past confirmed signals (arrows/zones) after the fact. This does not happen.
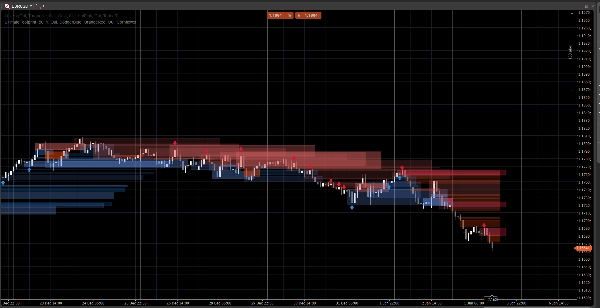
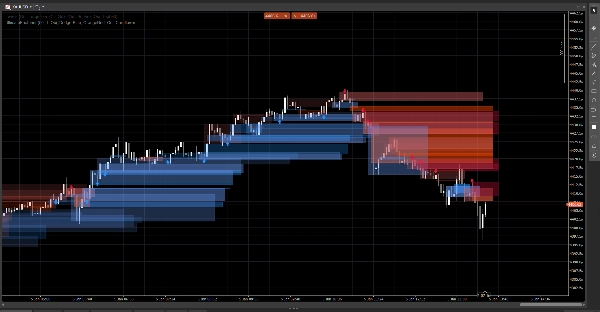
3) Why do zones sometimes change shape or opacity?
Because zones are volume-weighted using a Z-score model:
SMA(volume)+StdDev(volume)over your baseline period- opacity/alpha scales with the volume deviation
So if you change:
- Volume Baseline
- Volume Sensitivity
- or the symbol feed differs
The visual intensity can differ. The zone location stays price-based; the visibility can reflect volume context.
4) Why are some alerts “missing” or “off” sometimes?
There are 3 technical reasons, and they’re all intentional:
A) Alerts require a strict confluence condition
For a retest alert, the indicator requires:
- price overlaps the OB zone, AND
- a rejection candle condition is met (example: bullish rejection requires
Close > Open)
If price touches the zone but closes neutral / opposite, no retest alert is fired.
B) One-time alert logic (anti-spam)
Each OB has an internal flag (ex: Alerted) so you don’t get repeated alerts on every tick.
So if the first touch did not meet the rejection rule, and later it meets it but the flag was already set (depending on your version), it can appear “off”.
C) Chart type behavior (Renko / tick aggregation)
On Renko, the “current brick” is not a classic candle. During formation:
- Open/Close can be unstable or equal
- retest logic may happen intrabar but not confirm at close
In live trading, for maximum reliability:
- New OB alerts are usually clean
- Retest alerts are best treated as “confirmed rejection” alerts (not just a wick touch)
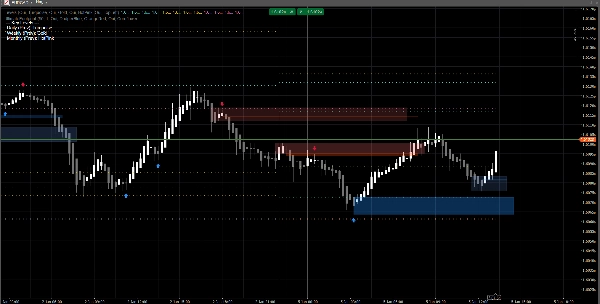
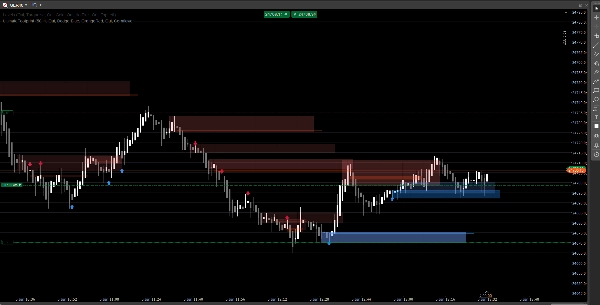
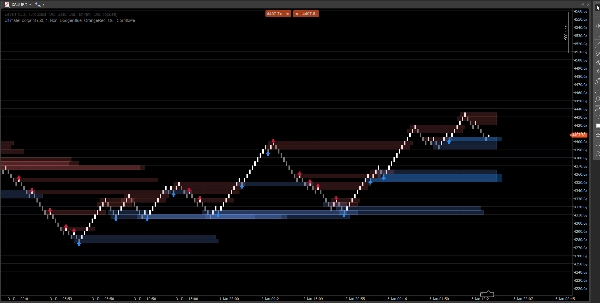
5) In the screenshot: why do some OBs not show an arrow (or why arrow doesn’t match every OB)?
Because zones and arrows are not the same engine:
- Zones (OB rectangles) can be displayed from zone detection logic (gap-derived OB / price action zones).
- Arrows are only printed when a structure event is detected:
- a swing high/low is broken (Break of Structure),
- then the algorithm searches backward to find the last opposite candle = the valid OB.
So you may see an OB zone without an arrow if:
- there was no validated swing break,
- the OB candidate didn’t meet the volume filter (if enabled),
- or it’s a zone created by the gap engine but not confirmed by the structure engine.
This is exactly why the tool is useful:
Zones give you the map. Arrows highlight the highest-confluence moments.
6) Can I force OBs to always match arrows?
Yes, technically you can run it in “signals-only” mode by disabling the zone layer you don’t want:
- Turn OFF Price Gaps if you only want structure-driven zones
- Turn OFF Show OB (zones) if you only want arrow-confirmed OBs
7) Does it work on all timeframes and symbols?
Yes, but results depend on:
- volatility,
- liquidity,
- tick volume quality,
- and the market session.
Crypto and indices behave differently from FX.
Notes & Disclaimer
This indicator is a visual decision-support tool, not a signal service and not financial advice.
All markets and timeframes behave differently — always validate on your data and manage risk appropriately. Past behavior does not guarantee future results.
Summary
Customer reviews
5 | 100 % | |
4 | 0 % | |
3 | 0 % | |
2 | 0 % | |
1 | 0 % |


