Description
Pinescriptlabs Store indicators: 🤖Pinescriptlabs Store cBots : (cBot) Gold & BTC BreakoutSession Pivots(new)
Prediction Based on Linreg & ATR
SmartTrend Support &
Resistance
Lines
Dynamic
Market Structure
Analysis
of
Turning
Points
Fibonacci
Linear
Regression
Multi-timeframe
Auto
Support and
Resistance
Trend
Lines
All
Support and
Resistance
Levels
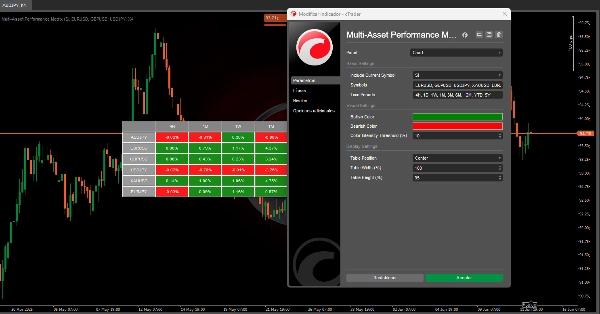
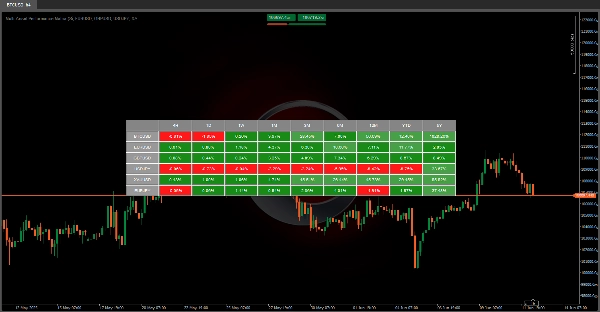
🚀 MULTI ASSET PERFORMANCE MATRIX 🚀
This algorithm is a powerful visual tool 📊 designed to display the percentage performance of multiple financial instruments across different time periods.
It transforms historical data into an efficient and intuitive visualization, allowing users to quickly assess the behavior of various financial assets.
❓ What Does This Tool Do?
1️⃣ 📈 Compares Assets: Shows how the prices of different financial instruments (like BTCUSD, EURUSD, XAUUSD, etc.) have changed over time.
- Timeframes: D (Daily) | 1W (Weekly) | 1M (Monthly) | 3M (Quarterly) | 6M (Semi-Annual) | 12M (Annual) | YTD (Year-to-Date) | 5Y (Last 5 Years)
2️⃣ 🎨 Highlights Trends: Uses color-coding (🟢, 🔴 ) to instantly identify which assets are rising or falling in each period.
3️⃣ ⏱️ Auto-Updates: Refreshes data every minute to reflect the latest market information.
💡 Why Is This Useful?
✔ 📊 Comparative Analysis: Enables side-by-side comparisons of multiple assets—ideal for portfolio management or selecting top-performing assets based on time horizons.
✔ 🛡️ Control: Evaluating an asset’s consistency (or volatility) across different periods helps assess associated risks.
✨ Key
✅ ⏳ Saves Time: Manually collecting and calculating this data would take hours—this tool does it instantly!
✅ 👀 Visually Clear: The color-coded system makes analysis easy, even for non-technical users.
✅ 🔄 Adaptable: Supports custom symbols, so you can track the assets that matter to you.
Summary
Customer reviews
5 | 100 % | |
4 | 0 % | |
3 | 0 % | |
2 | 0 % | |
1 | 0 % |