Indicator
RSI
Breakout
XAUUSD
ATR
Commodities
Signal
Supertrend
Crypto
BTCUSD
PREMIUM SSL CHANNEL
"PREMIUM SSL CHANNEL" logo
5.0
03/09/2025
171
Desktop
"PREMIUM SSL CHANNEL" uploaded image"PREMIUM SSL CHANNEL" uploaded image"PREMIUM SSL CHANNEL" uploaded image"PREMIUM SSL CHANNEL" uploaded image"PREMIUM SSL CHANNEL" uploaded image"PREMIUM SSL CHANNEL" uploaded image"PREMIUM SSL CHANNEL" uploaded image

Description

Pinescriptlabs Store indicators:                        🤖Pinescriptlabs  Store cBots :

 ICT Power of 3  (cBot) Gold & BTC BreakoutSession Pivots(new)YieldShield

SmartTrend Support &
Resistance Lines
       

Fair Value Gap Sessions                      
       

ZigZag

 BOS & CHOCH

RSI Trend Trigger

Channel Breakout System

Supertrend

Market Imbalance

Adaptive Trend Channel 

Dynamic Market Structure
Analysis of Turning Points

Order Block

Fibonacci Linear
Regression Multi-timeframe

Volume POC Heatmap

Dynamic RSI

Momentum Fair Value Gap

Market Flow Projection

Dynamic Trend Gradient

Multi-Level Candle Bias
Tracker

Zig-Zag Extremity Tracker

Reactive Moving Average

Auto-Trend Channel

Auto Support and
Resistance Trend Lines

All Support and
Resistance Levels

Leverage Liquidation Map

Zones Supply Demand

Dynamic Range Momentum


The Premium SSL Channel 🔍

Combines trend detection via a moving average, volatility assessment with ATR-based bands, and a short-term filter (SSL) to deliver an integrated analysis system. 💡 Its strength lies in the clarity of its visual signals and adaptability across markets, while its main challenge is minimizing lag and filtering sideways movements. With proper parameterization, it becomes a powerful tool for entry/exit decisions in trading. 🎯

1. Purpose & Trading Utility 📊

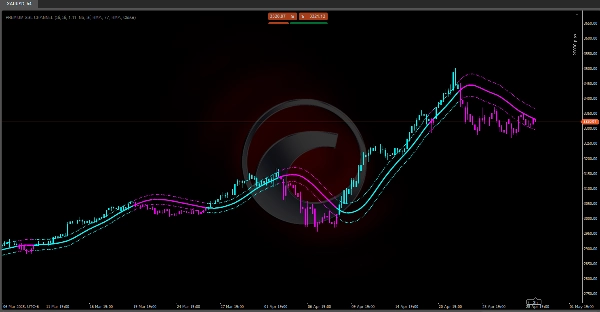
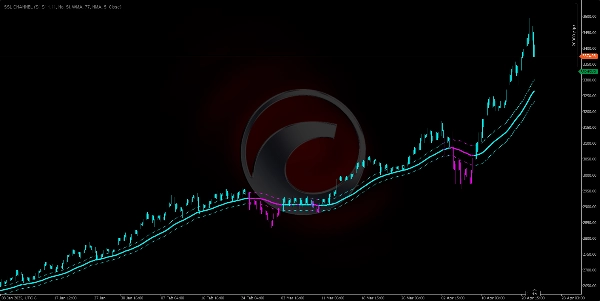
• Main trend detection: Thanks to a central line (the "Baseline"), the indicator shows the market’s dominant direction. 📈📉
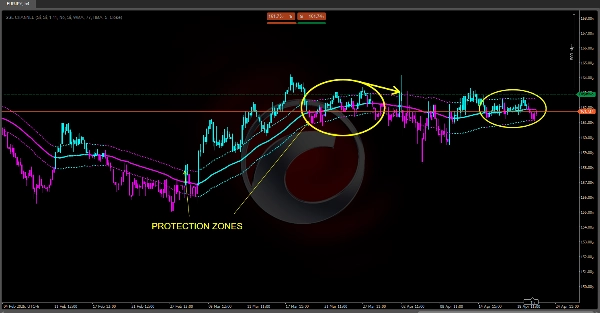
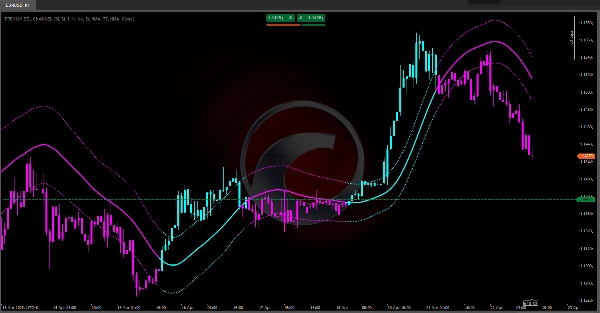
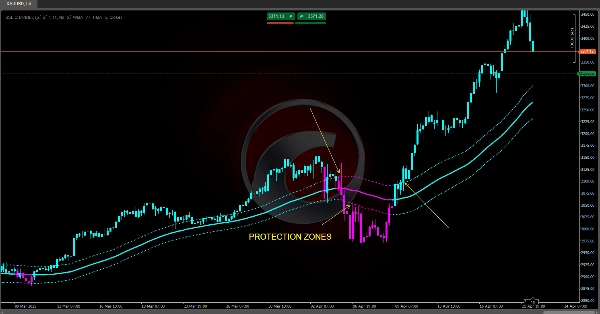
• Volatility measurement: Using an average range (ATR), it adjusts two bands (above/below the Baseline) as dynamic support/resistance zones. ⚡
• Noise filter & bias shift: The SSL channel (an adaptive moving average based on highs/lows) identifies short-term reversals for precise entries/exits. 🔄
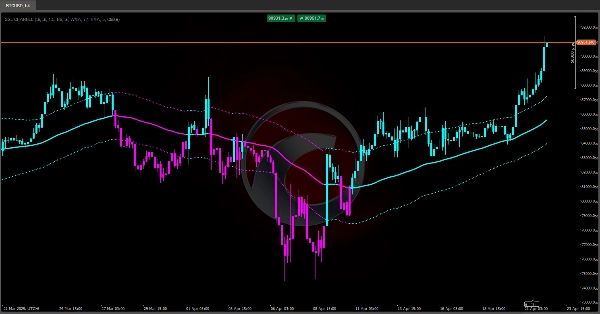
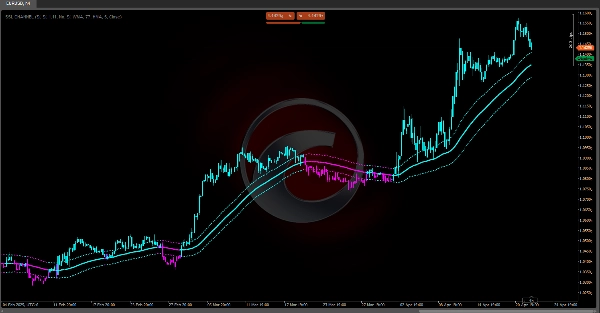
• Intuitive visualization: Colors price bars and lines by bias (cyan = bullish, magenta = bearish) for instant interpretation. 🎨

2. Core Components & Logic ⚙️

2.1. Central Line ("Baseline")

• Calculates a price moving average (SMA, EMA, WMA, or Hull) to smooth noise.
• Represents the market’s average value, showing the dominant trend:

  • Price above → Bullish trend. 🟢
  • Price below → Bearish trend. 🔴

2.2. Average Range (ATR)

• Measures real market volatility by averaging prior highs/lows/closes.
• Higher ATR = More volatility; Lower ATR = Calmer markets. 🌊

2.3. Dynamic Bands ("Up ATR" & "Down ATR")

• Up ATR = Baseline + (ATR × Multiplier)
• Down ATR = Baseline – (ATR × Multiplier)
• Acts as price channels:

  • Price touching upper band → Bullish strength. 🚀
  • Price near lower band → Bearish momentum. 🐻

2.4. SSL Channel (Signal-Smooth-Line)

• Uses moving averages on highs/lows separately.
• Direction logic:

  • Close above high MA → Bullish bias. ✅
  • Close below low MA → Bearish bias. ❌
  • In-between → Prior bias holds.
    • Acts as a short-term trend filter, confirming/contradicting the Baseline. 🔄

3. Signal Generation & Practical Use 🛠️

1. Trend Confirmation

  • Strong Bullish: Price > Up ATR. 🟢
  • Moderate Bullish: Up ATR > Price > Baseline.
  • Moderate Bearish: Baseline > Price > Down ATR.
  • Strong Bearish: Price < Down ATR. 🔴

2. SSL Filter

  • Entries: Go long only if SSL is above its line (or short if below). ⬆⬇
  • Exits: Partial/full exit when SSL reverses and crosses the opposite high/low MA. ✋

3. Bar Coloring

  • Price bars turn cyan (bullish) or magenta (bearish), synced with the Baseline for quick market reads. 🎨

4. Configurable Parameters & Impact ⚖️

• Baseline Period: Longer = smoother but laggy; shorter = responsive but noisy. 🐢⚡
• Band Multiplier: Higher = wider channel (fewer false signals); lower = tighter (more signals, more whipsaws). ↔️
• MA Type (SMA/EMA/WMA/HMA): Affects weighting of recent vs. historical prices. 📅
• SSL Period & Type: Defines short-term filter sensitivity. 🎚️

5.0
Reviews: 1
5
100 %
4
0 %
3
0 %
2
0 %
1
0 %
Customer reviews
November 1, 2025
Se ve que funciona bien acompañado de P,A
More from this author
Indicator
RSI
Breakout
XAUUSD
+6
ZigZag
ZigZag filters noise, spots trends, patterns, pivots, aiding analysis, trade management, and confirmations. 📉📈
Indicator
RSI
Breakout
XAUUSD
+6
Order Block
Identify bullish and bearish Order Blocks to spot key support/resistance levels and potential trend reversals! 📈🔄
Indicator
RSI
Breakout
XAUUSD
+5
Auto-Trend Channel
Adaptive trend channel using linear regression and Pearson correlation for dynamic support, resistance, and trends.
Indicator
RSI
XAUUSD
Breakout
+5
BOS & CHOCH
Market structural patterns , specifically the concepts of Change of Character (ChoCH) 🔄 and Break of Structure (BoS) 💥
Indicator
RSI
Breakout
XAUUSD
+5
Zones Supply Demand
📊Zones Supply & Demand: Identifies key price levels with high volume concentration, marking Supply/Demand Zones & Marke
Indicator
RSI
Breakout
Supertrend
All Support and Resistance Levels
"Identify key market zones and visualize support/resistance from multiple timeframes on a single chart.
Indicator
RSI
Breakout
XAUUSD
+6
Volume POC Heatmap
📊 Shows volume by price levels, highlights POC, and key zones. Identifies dynamic support/resistance and imbalances.
Indicator
RSI
Breakout
XAUUSD
+5
Supertrend
💹 Define a price channel 📈 and determine trend direction (bullish 🟢 or bearish 🔴).
Indicator
RSI
Breakout
XAUUSD
+6
Fair Value Gap Sessions
identify and highlight temporary market inefficiencies known as "fair value gaps" 🚨 within specific trading Sessions.
Indicator
RSI
Breakout
XAUUSD
+4
Dynamic Market Structure Analysis of Turning Points
Identify market structure effortlessly with swing highs, lows, CHoCH, and BOS levels for smart trading decisions! 📊🔍"
Indicator
Indices
RSI
XAUUSD
+7
RSI Divergence
Detects bullish and bearish divergences
Indicator
RSI
Breakout
Supertrend
Trend Heikin Multi MA
🚀 TrendHeikinMultiMA: Advanced trend detection using Heikin-Ashi smoothing & MAs! Eliminates noise, confirms real trend
Indicator
RSI
Breakout
XAUUSD
+4
Multi-Level Candle Bias Tracker
Price direction by calculating the probability of reaching new highs/lows. Shows levels & stats📈
Indicator
RSI
Breakout
Supertrend
Leverage Liquidation Map
📊 Liquidation Map: Potential areas where highly leveraged investors might face liquidations.
Indicator
RSI
Breakout
Supertrend
Market Trend OB
Price action to detect when the market changes trend (MSB) and defines, order blocks , ZigZag etc.📊
Advanced Market Structure Bos,Choch,SwinLevels, Order Blog
Advanced price action tool that combines multiple technical analysis concepts
Indicator
RSI
Breakout
Supertrend
Swing Levels
🔍 Automatically detect support and resistance levels based on "swings" or pivots
Indicator
RSI
Breakout
Supertrend
Zig-Zag Extremity Tracker
Dynamically adjusts regression channels based on ZigZag extremes, resetting when price breaks bands to track real trends
You may also like
SpreadCalculator - BossFXTrader
Spread Calculator to calculate the difference between two prices or values.
session final
Comprehensive time session indicator
Cumulative Delta Candles + VolumeProfile
Cumulative delta candles + volume profile
Indicator
XAUUSD
Commodities
ATR
+1
[Stellar Strategies] Visual Trend Momentum
Visual Trend Momentum is a MA/ATR/Volume trend tool. Visual signals for strong trends & reversals. Customizable. 📈📉
Hull Moving Average Colored
The traditional Hull Moving Average with different colours based on the slope (direction) of the trend.
Indicator
Indices
RSI
XAUUSD
+8
RSI Trend Trigger
RSI Trend Trigger 📈: Uses dual-layer RSI to spot trends & generate clear buy/sell signals.
Commodity Channel Index Smoothed w Alerts_NSC
Smoothed CCI alerts! Audio & arrow signals for +/-100 crosses. Custom sounds & arrow filters. Precision trading!
Indicator
NAS100
Indices
NZDUSD
+9
MultiTimeFrame MovingAverage MTF MA
MultiTimeframe MA
market session
Market session indicator (Asia, Frankfurt, New York, London)
Indicator
Scalping
Grafico Diario
Bússola para Decisões de Trading Precisas e Eficientes!
Session Highlight Framer
Frame the sessions
Indicator
Stocks
Forex
MACD
MACDVolume
😎Read the description before purchasing💩
Indicator
NAS100
NZDUSD
Martingale
+26
CRT Indcator
CRTIndicator
Previous Day Liquidity Zones (PDH - PDL)
Useful indicator for traders who want to visualize key price levels based on previous daily highs and lows.
VegaXLR - cTrader Multi-Timeframe Pivot Pro
Customizable multi-timeframe pivot point indicator for cTrader with alerts, Fibonacci, CPR, and more!
Indicator
Signal
dark-cloud
The Dark Cloud Cover indicator detects a bearish reversal pattern, marking key candles and confirming signals based on v
Indicator
Indices
Stocks
Commodities
+2
DayOfWeek - FXMaster
Day of Week Indicator for cTrader
Indicator
NAS100
XAUUSD
Commodities
+10
MARKET_STRUCTURE BOS_CHoCH
MarketStructurePro – Smart BOS/CHoCH